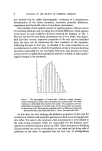
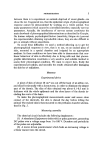
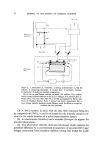
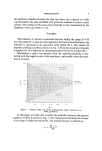
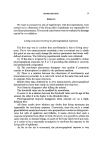
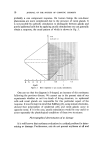
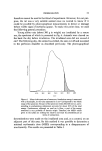
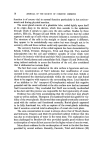
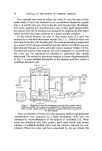
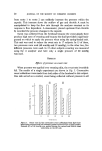
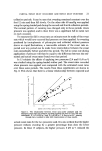
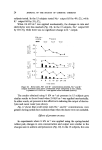
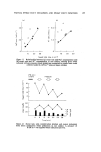
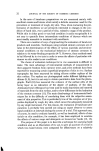
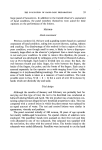
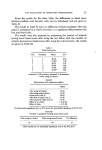
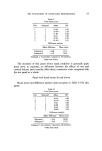
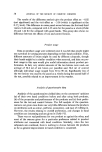
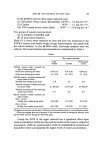
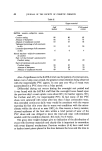
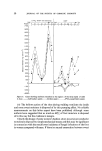
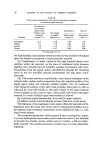
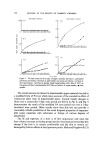
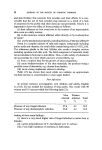
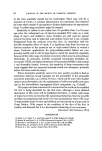
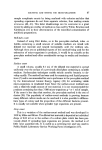
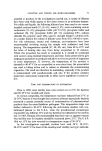
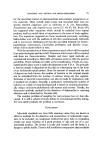
PHOREOGRAPHY 11 therefore cannot be used in that kind of experiment. However, for our pur- pose, the rat was a very suitable animal since we wanted to know if it could be possible by phoreographical measurements to detect uv damage before visible signs of erythema appear. To make this point clear, we used the following general procedure. Young albino rats (about 300 g in weight) are irradiated by a xenon arc, the spectrum of which is presented in Fig. 6. Animals were shaved on the back the day before irradiation. The irradiated area did not exceed 4 cm 2. The following day, the animal was killed, the skin cut off and mounted in the perfusion chamber as described previously. The phoreographical 400 380 360 340 ,320 300 280 (nm) Figure 6. Ultra-violet spectrum of xenon are. Irradiation energy is measured with a thermopile, so the value expressed in J cm -2 corresponds to the whole range of the spectrum. The part of the spectrum within 290-320 nm (i.e. corre- sponding to erythematous radiations) accounts for about 10 % of the total energy. Furthermore, although we used an ir filter, a part of the energy measured is very probably of thermic origin. Therefore, the MED values given in the tables are nothing but relative and must be considered just as terms of comparison. determinations were made on the irradiated area and, as a control, on an adjacent part of this area. By this method it was possible to determine a minimal crythematic dose (MED) corresponding to a disappearance of non-linearity. The results are presented in Table I.

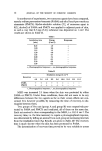
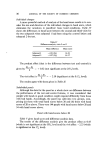
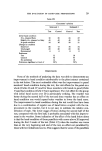
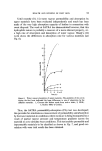
12 JOURNAL OF THE SOCIETY OF COSMETIC CHEMISTS In another set of experiments, two sunscreen agents have been compared, namely sodiumpara-amino-benzoate (PABA) and ethyl hexyl-para-methoxy cinnamate (PMCX). Hydro-alcoholic solution (3•o of sunscreen agent in 95• alcohol) of PABA and PMCX was applied to adjacent parts of skin, in such a way that 0.5 mg of dry substance was deposited on 1 cm 2. The results are shown in Table II. Table I Irradiation time Energy Responses (min) (J cm -•) 0.45 1.9 + 1.00 2.6 1.15 3.3 1.30 4.0 - 1.45 4.7 - 2.00 5.4 - 2.15 6.1 - 2.30 6.8 - 3.00 8.2 - +, Phoreographical response -, no phoreographical response. Table II Irradiation energy (J cm -•) Sunscreen 4.0 5.4 6.8 8.2 9.6 10.0 10.5 11.1 11.8 PABA + + + + + + - - - PMCX + + + + + + - - - +, Phoreographical response -, no phoreographical response. MED was increased 2.5 times when the skin was protected by either PABA or PMCX. Under these conditions, there did not seem to be any differences between the two agents as far as their screen effects are con- cerned. It is however possible, by measuring the time of recovery, to dis- tinguish between them. Two groups of five rats (group A and group B) were respectively pro- tected by PABA and PMCX and irradiated, all of them on the same day. Each rat received a dose corresponding to the MED, i.e. 10.5 J cm -2. The recovery time, i.e. the time necessary to regain a phoreographical response, was determined by killing an animal from each group at increasing intervals from the irradiation time (To). Results are given in Table III. The recovery time is much shorter when the skin has been protected by PABA. The determination of recovery time proved to be very suitable to assess
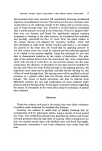
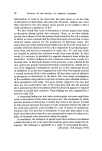
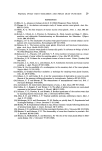
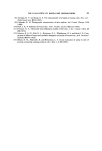
Purchased for the exclusive use of nofirst nolast (unknown)
From: SCC Media Library & Resource Center (library.scconline.org)