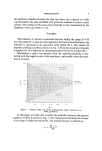
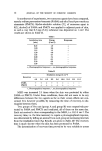
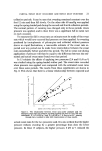
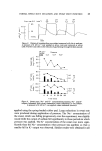
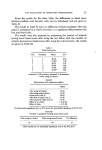
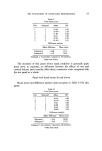
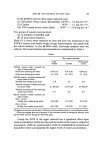
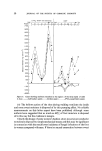
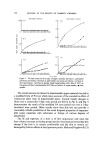
THE EVALUATION OF HAND-CARE PREPARATIONS 35 From the results for the three visits, the differences in hand score between products and between visits can be calculated, and are given in Table IL The results in Table H show no difference between products when the panel is considered as a whole, but there is a significant effect between the first and third visits. The results were also analysed by comparing the number of subjects having lower hand scores after using the test lotion with the number of subjects having lower hand scores after using the control lotion the results are given in Table III. Table I Total hand scores Visit Subpanel Mean SD 1 1 16.19 6.18 2 1 15.65. 5.49 3 1 12.74 3.31 1 2 16.28 5.88 2 2 15.30 5.29 3 2 13.03. 3.83 Subpanel 1,102 members subpanel 2, 96 members. *After using test lotion. Table II Hand scores, both subpanels together Mean After using test lotion 14.34 After using control lotion 14.02 Initial score (visit 1) 16.24 After first 2 weeks (visit 2) 15.48 After second 2 weeks (visit 3) 12.89 Effect of test lotion q- 0.32 (1) Effect of visits -- 3.35 (2) (1), Statistically significant only at 50 % level (2), statistically significant at 0.1 • level. Table III Number of panellists showing lower hand scores After using test lotion After using control lotion No difference 87 94 17 These results are not statistically significant even at the 50 % level.

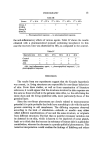
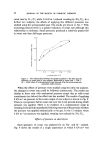
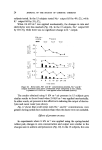
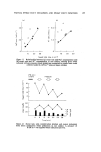
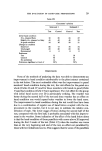
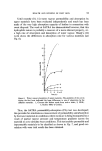
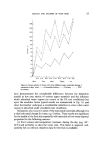
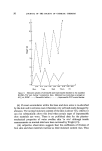
36 JOURNAL OF THE SOCIETY OF COSMETIC CHEMISTS Individual changes A more powerful method of analysis of the hand score results is to con- sider the size and direction of the individual changes in hand score, which eliminates the variations in panellists' basic hand conditions. Table IV shows the differences in hand score between the second and third visits for the two subpanels when subpanel 1 had been using the control lotion and subpanel 2 the test. Table IV Difference analysis, visits 2 and 3 Mean difference Mean score Subpanel 1 ---2.91 (D 0 14.19 Subpanel 2 ---2.27 (D2) 14.17 The product effect (that is the difference between test and control) is given by -- - + 0.32 (not significant at the 255/o level). The visit effect is D• +D2 -- 2.59 (significant at the 0.1 •o level). The results agree with those given in Table II. Subdivided panels Although the data for the panel as a whole show no difference between the performance of the test and control lotions, it was considered that people with hands in good condition might respond differently from those with bad hands. Accordingly, the panel was split into two groups, com- prising (a) those with total hand scores below 20 and (b) those with hand scores of 20 or above. There were 144 people with hand scores below 20 and 54 with hand scores above. Panel with hand scores below 20 Table V gives hand score and difference analysis data. The results of the difference analysis give the product effect as 0.45 (whic h is not significant at the 50}/o level) and the visit effect -2.23 (which is sii•ntfic/lnt at the 5}/o ievei):
Purchased for the exclusive use of nofirst nolast (unknown)
From: SCC Media Library & Resource Center (library.scconline.org)