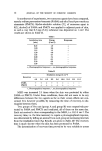
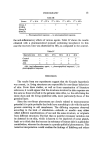
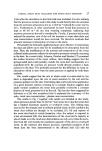
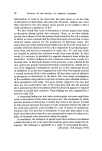
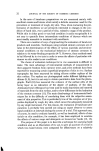
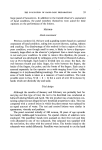
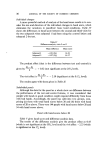
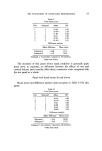
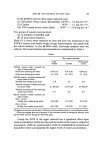
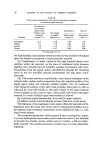
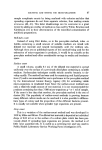
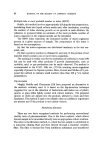
THE EVALUATION OF HAND-CARE PREPARATIONS 37 Table V Total hand scores Visit Subpanel Mean S D 1 1 13.18 3.54 2 1 14.47' 5.14 3 1 11.80 2.82 1 2 13.41 3.30 2 2 13.70 4.24 3 2 11.91' 3.31 Difference analysis Mean difference Mean score Subpanel 1 --2.68 13.13 Subpanel 2 --1.79 12.81 Subpanel 1, 74 members subpanel 2, 70 members. *After test lotion. The members of this panel whose hand condition is generally quite good show, as expected, no difference between the effects of test and control lotions, and a smaller effect due to successive visits compared with the test panel as a whole. Panel with hand scores 20 and above Hand score and difference analysis data are given in Table VI for this panel. Table VI Total hand scores Visit Subpanel Mean SD 1 1 24.14 4.30 2 1 18.75' 5.25 3 1 15.21 3.24 1 2 24.00 4.05 2 2 19.62 5.49 3 2 16.04' 3.54 Difference analysis Mean difference Mean s•ore Subpanel 1 --3.54 16.98 Subpanel 2 --3.58 17.83 Subpanel 1, 28 members i subpanel 2, 2i5 members. *After test lotiort.

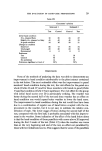
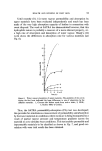
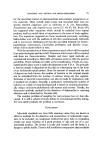
38 JOURNAL OF THE SOCIETY OF COSMETIC CHEMISTS The results of the difference analysis give the product effect as -0.02 (not significant) and the visit effect as -3.56 (which is significant at the 0.1 •o level). The difference in mean panel scores between the first and third visits is 8.44 units, compared with 3.35 units for the panel as a whole (Table II) and 1.44 for the subpanel with good hands. This group also shows no difference between the effects of test and control lotions. Product usage Data on product usage were collected since it was felt that people might use a product in varying amounts depending on their hand condition. Thus, different amounts of lotion might be used by different subpanels, though their hands might be in similar condition when assessed, and data on pro- duct usage in this case would give useful information about product per- formance. In fact, very similar amounts of the two lotions were usedman average of 56.2 ml of test lotion per panellist and 56.6 ml of control although individual usage ranged from 30 to 90 ml. Significantly less of the two lotions was used by the panel as a whole during the second half of the test, possibly related to an improvement in the weather. Analysis of questionnaire data Analysis of the questionnaires yielded data on the consumers' opinions (a) of their own hand conditions before and after using both products, (b) of the properties and performance of the products and (c) their prefer- ences for the test and control lotions. The full analysis of the question- naires is not given since there was very little difference between the products on attributes such as colour, perfume, consistency, and ease of rubbing in. However, the results relating to overall preferences, and changes in hand condition are interesting and are given in Table VII. There was no real preference for one product as against the other, and most of the reasons given for a particular preference related to product attributes not connected with hand condition. Similarly, when the two subpanels are combined, there is nothing to choose between the products as far as general improvement in hand condition is concerned.
Purchased for the exclusive use of nofirst nolast (unknown)
From: SCC Media Library & Resource Center (library.scconline.org)