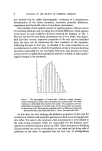
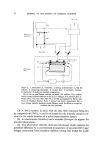
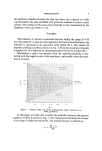
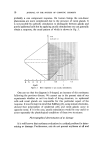
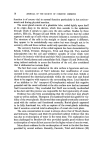
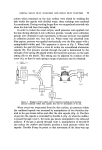
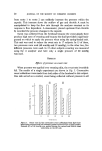
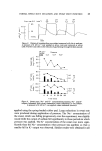
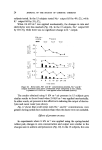
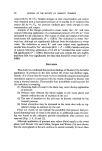
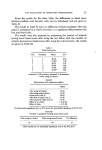
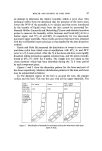
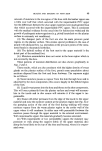
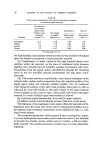
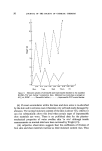
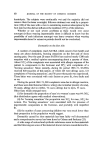
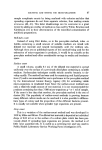
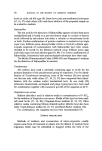
20 JOURNAL OF THE SOCIETY OF COSMETIC CHEMISTS from route 1 to route 2 can suddenly increase the pressure within the capsule. This increase slows the outflow of gas and throttle A must be manipulated to keep the flow rate through the analyser constant as its response is flow dependent. A manometer, placed upstream from throttle B, recorded the pressure changes in the capsule. Sweat was collected from the forehead because the sweat glands there produce high rates of sweating and because the skull provided a rigid back- ground on which to apply the pressure when using the spring-loaded unit. This unit was used to reduce the sweat rate in 17 subjects. In 15 of these, two pressures were used (60 mmHg and 18 mmHg) in the other two, five different pressures were used. In 15 other subjects sweating was measured using the i r analyser and here only a single pressure of 60 mmHg was used. RESULTS Effects of pressure on sweat rate When pressure was applied over sweating skin, the sweat rate invariably fell. The results of a single experiment are shown in Fig. 5. Consecutive sweat collections were made from both sides of the forehead in this subject. One side served as a control, sweat being collected without pressure in all 4 8 12 16 20 Time (mm) Figure 5. Sweat rates in five consecutive sweat collections from right fore- head (open columns) and left forehead (shaded columns) from a single subject. Pressure (P) of 60 mmHg was applied during the second and fourth sweat collections on the left side.

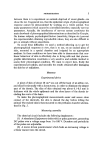
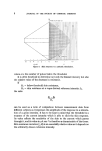
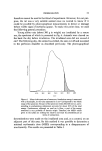
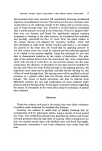
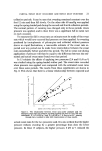
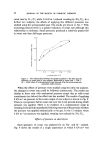
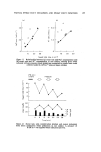
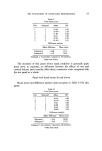
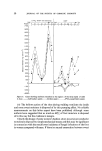
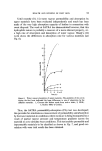
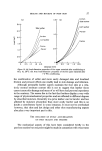
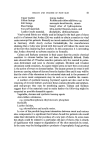
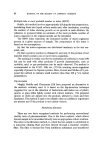
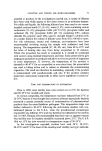
PARTIAL SWEAT DUCT OCCLUSION AND SWEAT DUCT FUNCTION 21 collection periods. It can be seen that sweating remained constant over the first 12 min and then fell slowly. On the other side 60 mmHg was applied using the spring-loaded pad during the second and fourth collection periods. The normal pattern of sweating was changed only in those periods where pressure was applied, and in these there was a significant fall in sweat rate on each occasion. To measure this fall in sweat rate an estimate must be made of the sweat rate which would have occurred had pressure not been applied. As sweating produced by iontophoresis of pilocarpine and collected without pressure shows no rapid fluctuations, a reasonable estimate of the sweat rate ex- pected over any period can be made from interpolation between the sweat rates immediately before and after this period. The fall in sweat rate during application of pressure will then be equal to the difference between the esti- mated and actual sweat rates found over that period. In 15 subjects the effects of applying two pressures (2.4 and 8 kN m-") was studied using the spring-loaded rubber pad. The sweat rates recorded when pressure was applied were compared with the estimated sweat rates over these same periods. The results from these experiments are shown in Fig. 6. This shows that there is a linear relationship between expected and 2O I I t o IO 20 :50 I 40 Sweat rate without pressure (rag 4 min -•) Figure 6. The relationship between sweat rate under pressure and the estimated sweat rate had pressure not been applied (see text for how this was. calculated). P• is 2.4 kN m -a and Pa is 8 kN m -a. A line set at 45 ø, passing through zero, is added to help with interpretation of these results. actual sweat rates for the two pressures used. It is also evident that the higher pressure reduces sweating by a greater percentage than does the lower pressure. In these 15 subjects, the higher pressure, 8 kN m -a, reduced the
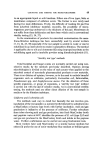
Purchased for the exclusive use of nofirst nolast (unknown)
From: SCC Media Library & Resource Center (library.scconline.org)