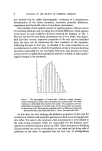
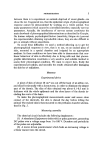
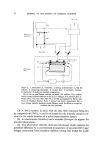
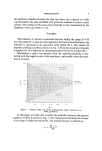
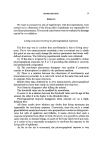
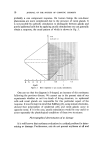
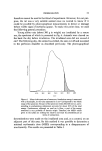
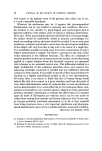
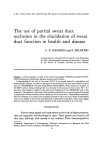
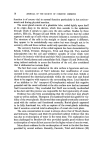
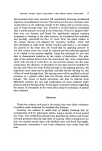
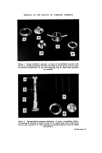
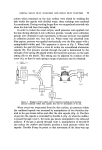
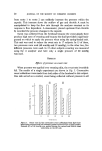
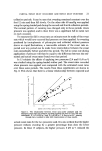
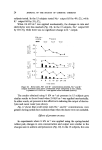
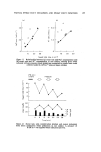
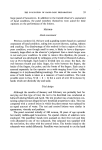
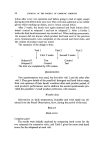
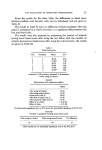
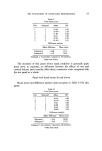
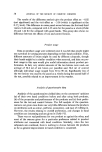
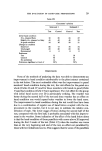
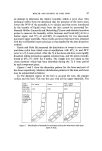
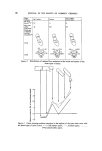
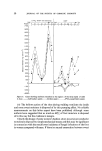
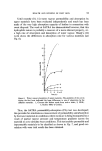
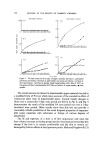
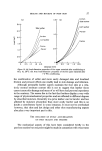
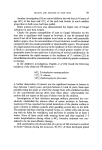
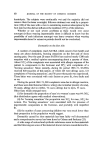
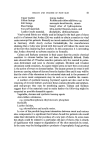
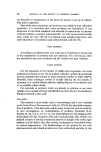
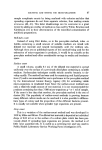
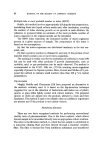
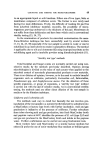
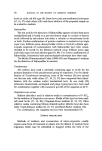
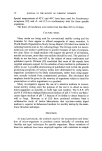
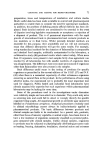
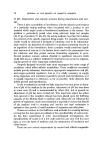
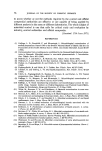
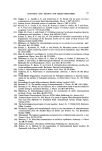
22 JOURNAL OF THE SOCIETY OF COSMETIC CHEMISTS sweat rate by 534-2•o while 2.4 kN m -2 reduced sweating by 304-2•o. In a further two subjects, the effects of applying five different pressures was studied using the spring-loaded pad. The results are shown in Fig. 7. With increasing pressure there is a greater reduction of sweat rate although this relationship is nonlinear. Small pressures produced a relatively greater fall in sweat rate than did larger pressures. 75 5O 2• / 3,3 6.6 9.9 13 2 Pressure (kN m -A) Figure 7. The relationship between the pressure applied to the skin and the reduction in sweat rate in two subjects. Reduction in sweat rate -- 100 x (E - M)/E where E is the estimated sweat rate and M is the actual sweat rate measured under pressure. When the effects of pressure were studied using the infra-red analyser, the changes in sweat rate could be followed continuously. The results are similar to those seen with mechanical pressure except that as with sweat constituents (see below) the effect was less marked. The results of applying 8 kN m -2 air pressure to the sweat output of one subject is shown in Fig. 8. There is a progressive fall in sweat rate over the 4 min periods during which pressure was applied. There is no evidence of a compensatory surge in sweating in the period immediately following removal of the pressure whether the pressure was applied mechanically or by gas. In the 15 subjects where 8 kN m -2 air pressure was applied, sweating was reduced by 24-+-5•o. Effects of pressure on electrolytes Each specimen of sweat was analysed for its Na + and K + content. Fig. 9 shows the results of a single experiment in which 8 kN m -2 was

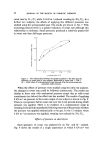
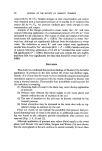
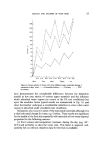
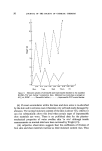
PARTIAL SWEAT DUCT OCCLUSION AND SWEAT DUCT FUNCTION 23 60 8.0 7 E 30 O• 4.0 • mmHcJ on off on off Flow rate 2.0 L rain -•) O O • • I rain Figure 8. Pattern of sweating from one subject measured with the ir analyser. A pressure of 8 kN m -• was applied at arrow (on) and removed at arrow (off). The flow rate refers to the velocity of gas flowing through the skin capsule. 2% pilo- Pressure cor•ne • qO I t- •" I0 60: I I I =._'_ +ø t2.0 • 6. o ½ 4 8 12 16 20 24 28 Time (rain) Figure 9. Sweat rates, Na + and K + concentrations (circles), Na + and K + outputs (columns) from seven consecutive sweat collections in one subject. A pressure of 8 kN m -a was applied where indicated (arrows). applied using the spring-loaded rubber pad. Large reductions in sweat rate were produced during application of pressure. The Na* concentration of the sweat, which was falling progressively over the experiment, was slightly raised while the output of sodium fell significantly in those periods in which pressure was applied. The K* concentration of the sweat rose more signi- ficantly than the Na* concentration when pressure was applied, so that a smaller fall in K* output was observed. Similar results were obtained in all
Purchased for the exclusive use of nofirst nolast (unknown)
From: SCC Media Library & Resource Center (library.scconline.org)