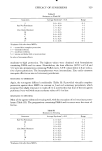
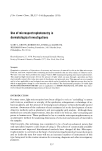
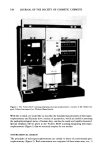
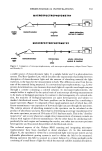
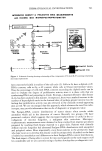
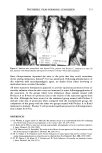
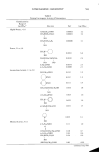
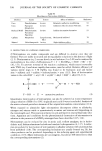
SUNSCREEN EFFECTIVENESS 561 as to determine how far a periodic heat wave can travel in the sample before excessive heat dissipation occurs. In the work presented here, PAS was used to obtain in situ ultraviolet photoacoustic spectra from which the sunscreening effectiveness and the substantivity of several sunscreen formulations applied directly to intact, excised newborn rat skin were evaluated. MATERIALS AND EQUIPMENT Neonatal rats were sacrificed 24 hr post parturn. Samples of full-thickness skin 4 x 4 cm were excised and allowed to equilibrate at ambient conditions for 48 hr. The sam- ples were cut into 1.5 x 0.5-cm sections to which the sunscreen formulations were ap- plied. The formulated sunscreens used in this study are given in Table 1. The dual-beam photoacoustic spectrometer was designed and built at our research facility. The light from a 1000 W Xe lamp was directed through a 0.25 m f/3.5 Ebert monochrometer equipped with two gratings, one blazed for the ultraviolet and the other for the visible region. The monochrometer was driven by a stepper motor equipped with TTL logic and controlled from an H-P 9825A calculator interfaced with an H-P 6940B multiprogrammer. The output from the monochrometer was mechanically chopped by a variable-speed chopper. The periodically chopped monochromatic light beam was split into two beams by a reflective beam splitter. The beams were directed into two photoacoustic cells (8), one containing the sample and tl•e other containing carbon-black. The acoustic signal generated in each cell was de- tected by a high-sensitivity microphone whose output was processed by preamplifiers and magnitude- and phase-sensitive, lock-in amplifiers (one for each cell). The outputs from the lock-in amplifiers were directed to a ratio meter operating in the A/B mode, i.e., sample signal/carbon-black signal. The sample's signal was thereby normalized against the lamp power spectrum at all wavelengths to provide a normalized spectrum. The ratioed output was processed by the multiprogrammer and calculator to yield the photoacoustic spectrum which was plotted on a digital plotter. METHOD The actual "in use" situation was obtained by uniformly applying a fixed amount of the formulated product to the stratum corneum of the 1.5 x 0.5-cm sample of intact, ex- cised, full-thickness neonatal rat skin. The sunscreening effectiveness and substantivity to the skin of the various sunscreen formulations were obtained as follows. After a 30- min postapplication drying time at ambient conditions, a photoacoustic spectrum over the 240 to 440-nm region was obtained. Immediately following the spectral measure- ment (53 min postapplication), the sample was soaked with constant stirring for 60 or Table I Sunscreen Formulations Active Ingredients A a B" PABA 5.0% Padimate-O c 3.3 % •Vehicle contains 5 5 % alcohol. bVehicle contains an acrylic/acrylate copolymer film former. cOctyl Dimethyl PABA.

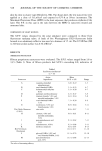
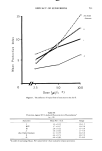
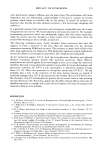
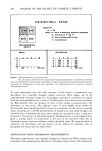
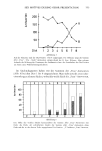
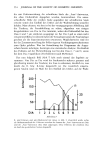
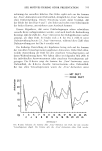
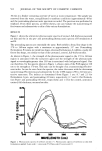
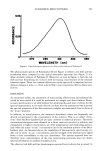
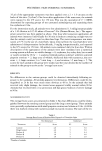
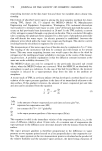
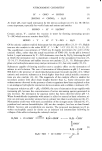
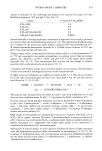
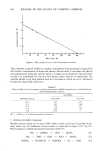
562 JOURNAL OF THE SOCIETY OF COSMETIC CHEMISTS 30 min in a beaker containing one liter of water at room temperature. The sample was removed from the water, reequilibrated to ambient conditions (approximately 48 hr) and the postsoaking photoacoustic spectrum recorded. The previous was performed in triplicate. From these spectra, as will be shown, one can evaluate the sunscreening ef- fectiveness and substantivity to skin of the various formulations. RESULTS Figure 1 shows the ultraviolet photoacoustic spectra of excised, full-thickness neonatal rat skin and the in situ pre- and postsoaking photoacoustic spectra of Formulations A and B. The presoaking spectra are essentially the same. Both exhibit a broad line shape in the 270 to 340-nm region with a maximum at approximately 317 nm. Postsoaking, Formulation B retains its initial line shape, whereas Formulation A exhibits a vastly dif- ferent line shape, one similar to that of the untreated, control, full-thickness skin. As shown in Figure 1, the strength of the photoacoustic signal in the 270 to 340-nm region is associated with the sunscreen agent and the strength of the photoacoustic signal at wavelengths greater than 369 nm is associated with background signal. One can therefore, for the spectra shown in Figure 1, obtain a ratio of the PAS signal at 320 nm to its strength at 370 nm. This ratio can be thought of as a sunscreening effective- ness index. As can be seen from the spectra, the index decreases with the decreasing sunscreening effectiveness and substantivity for the UVB region (290 to 320 nm) pro- tective sunscreen. The indices as determined from Figure 1 are: 8.7 and 2.3 for Formulation A pre- and postsoaking (30 min), respectively 6.7 and 6.4 for Formula- tion B pre- and postsoaking (60 min), respectively and 1.4 for the control, untreated, excised, full-thickness, neonatal rat skin. 0.76 Z O45 o• o•o O. IB & I ! I 2•0 •ZO 5•0 4OO 450 WAVELENGTH (nm) Figure 1. Photoacoustic spectra of newborn rat skin (+). Photoacoustic spectra of newborn rat skin with formulations applied: A pre-soak (-), post-soak (V) B pre-soak (ru), post-soak (O)
Purchased for the exclusive use of nofirst nolast (unknown)
From: SCC Media Library & Resource Center (library.scconline.org)