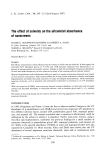
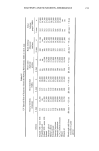
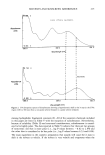
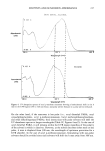
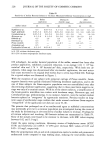
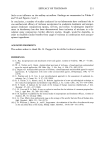
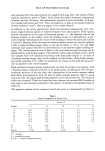
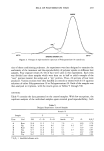
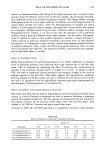
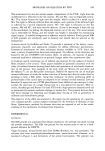
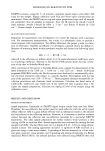
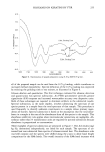
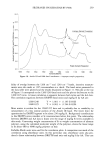
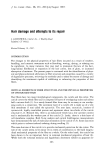
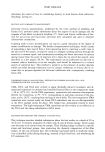
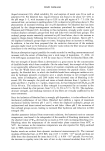
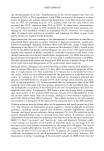
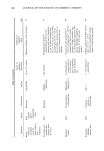
256 JOURNAL OF THE SOCIETY OF COSMETIC CHEMISTS .148 .119 .091 uJ .063 z o • .034 .006 - .021 - .050 • i i i / i i i I i 1850 1750 1650 1550 1450 1350 1250 1150 1050 950 WAVENUMBERS Figure 7. Use of spectral subtraction techniques for qualitative analysis of hair fiber surface. the Si content by AA. Attempts were made to correlate band height and area with AA data for a large number of treated hair samples. The precision of the correlation using spectral subtraction was not acceptable. Spectral subtraction is a subjective technique and rarely does one have an IR band that is isolated from the majority of the other bands in the sample. In this case for siloxane detection, the major constituent of the sample must be subtracted to leave a minor constituent spectrum. No bands other than those for SiMe and SiOSi are present after subtraction, to judge the efficiency of the subtrac- tion. All of these limitations contribute to the variability and lack of precision for quantitating siloxane on hair using spectral subtraction. However, spectral subtraction is a very valuable technique for identifying constituents in a mixture and for qualita- tively viewing trends of constituent concentrations. Band ratio techniques are used for quantitation in infrared spectroscopy, especially with difficult samples that require sampling with other than simple solutions. The band ratio technique involves measurement of the band intensity of an internal standard relative to the intensity of a band for the unknown species. An internal standard may be a material added in known quantities to the sample or may be a part of the sample. For surface analysis, selection of a keratin band as the internal standard is a reliable ap- proach. This approach has been used successfully for in vivo quantitation of siloxanes on human skin using FTIR-ATR (12). A band ratio technique was evaluated for these studies of siloxane on hair.

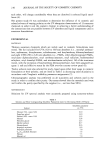
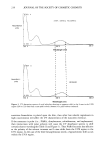
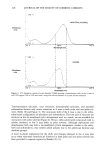
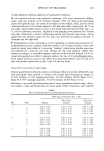
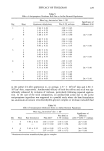
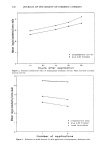
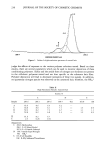
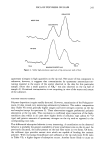
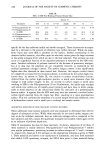
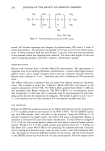
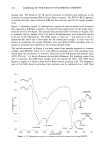
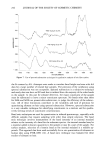
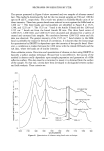
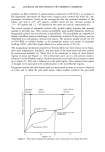
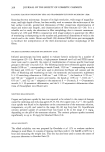
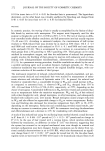
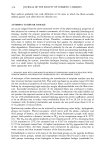
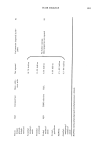
SILOXANES ON KERATINS BY FTIR 257 The spectra presented in Figure 8 show untreated and two samples of siloxane-treated hair. The mg/kg Si determined by AA for the two treated samples are 550 and 1190 for spectra B and C, respectively. The y-scale was plotted in Kubelka-Munk units of ra- diant intensity. Three hair-protein bands were selected to ratio against the SiMe band at 1260 cm -•. The three bands and wavenumbers are identified in Figure 8 at 1525, 1240, and 1225 cm-•. The 1525 cm-• band is the Amide II band and the 1240 and 1225 cm -• bands are from the broad Amide III area. The three band ratios of 1260/1525, 1260/1240, and 1260/1225 were calculated and tabulated for a variety of treated and untreated hair samples. No correlation between 1260/1525 ratios and AA data was observed. The greater intensity of the 1525 cm-1 band relative to the SiMe band is probably the reason for the lack of correlation. It is known that the linear range for quantitation by DRIFTS is dependent upon the intensity of the specific band. How- ever, a correlation is evident between 'the 1260 ratios with the Amide III bands and the AA data, where the bands are of similar intensity. Data validation criteria. Detection and quantitation of siloxane on hair using DRIFTS is basically a surface analysis technique. Because hair is non-reflective, the succes• of the method is almost totally dependent upon sample preparation and generation of a KBr reflective surface. The data must be scrutinized to insure it is obtained from the surface of the sample. To that end, criteria have been developed to distinguish between surface and bulk analysis. These criteria are: 49.0 42.7 35.9 29.1 22.3 15.5 8.7 1.9 r 1850 Untreated Hair 550 mg/kg Si by AA 1190 mg/kg Si by AA 1525 cm - • 1260 cm- • 1240 c 1225 cm - • I I I I I I • 1750 1650 1550 1450 1350 1250 1150 WAVENUMBERS Figure 8. Quantitation of siloxane using band ratio technique. i 1050 i 950
Purchased for the exclusive use of nofirst nolast (unknown)
From: SCC Media Library & Resource Center (library.scconline.org)