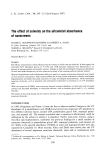
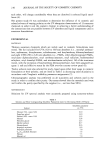
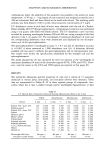
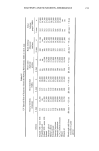
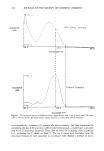
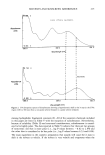
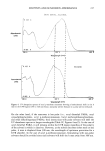
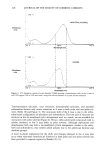
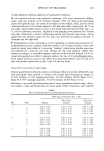
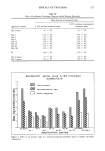
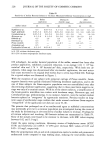
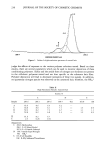
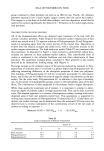
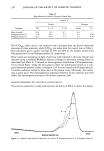
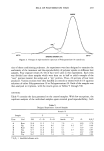
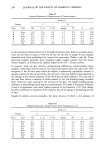
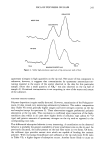
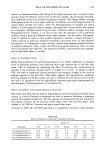
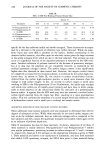
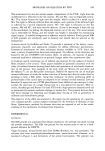
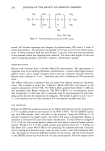
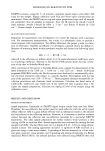
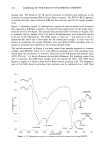
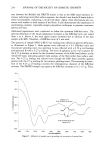
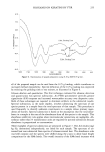
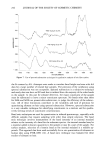
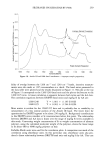
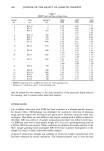
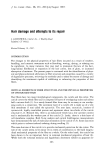
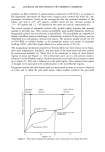
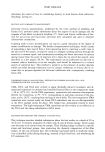
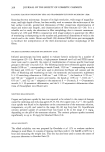
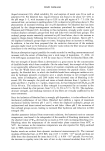
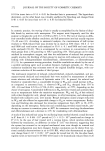
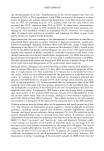
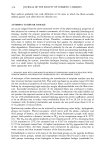
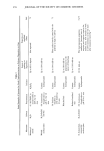
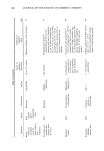
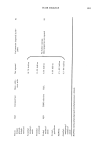
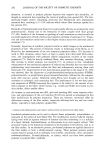
258 JOURNAL OF THE SOCIETY OF COSMETIC CHEMISTS 1) Amide I band at 1660 cm-• and Amide II band at 1525 cm-• 2) Band ratio intensities of 1240/1225 • 1.3 The importance of the Amide I and II band maxima positions is described earlier in the Method Development section. Data points generated with shifted Amide band posi- tions should be deleted from the study and the samples prepared again. The second criterion concerns the Amide III band intensities which are being used as internal stan- dards. It appears that if sufficient agitation does not occur during grinding, the 1260 cm-• band intensity is too large relative to the protein contribution. The indicator for acceptable sample preparation is the 1240/1225 band ratio, where the value must be •1.3. Examples of Amide I and II band shifts and improper 1240/1225 ratio are illustrated in Figures 9 and 10, respectively. CORRELATION OF DRIFTS AND AA DATA The DRIFTS/AA data is summarized in Table I. The siloxane polymer used to treat the hair samples was based upon a 100 DP (degree of polymerization) 2 mole % amine- functional polymer or derivative. The mg/kg Si values determined from AA analysis cover the range of 180 to 1840. The two untreated hair samples exhibit non-zero back- ground IR ratios due to the breadth of the Amide III band, as illustrated in Figure 8. The Amide III band maximum is close to 1240 wavenumbers. But, due to the possi- 51.0 43.8 36.5 29.2 .•21.9 14.6 7.3 1680 cm- • • 1540 cm- • ____ 1 • i I I 1 I I i I 1 50 1750 1650 1550 1450 1350 1250 1150 1050 950 WAVENUMBERS Figure 9. Amide I and Amide II band maxima shifts--bulk vs surface analysis.

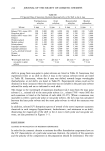
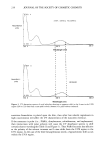
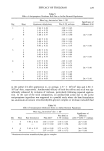
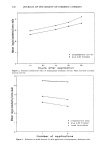
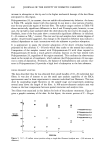
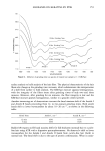
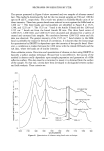
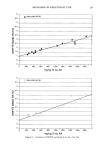
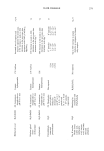
SILOXANES ON KERATINS BY FTIR 259 51.0 44.0 37.0 30.0 23.0 16.0 9.0 2.0 n Proper Sample Preparation r i i i i i i 1 i i 1850 1750 1650 1550 1450 1350 1250 1150 1050 950 WAVENUMBERS Figure 10. Amide III and SiMe band interference--improper sample preparation. bility of overlap between the 1260 cm -t and 1240 cm -t bands, intensity measure- ments were also made at 1225 wavenumbers as a check. The band ratios presented in the data table were plotted and the results illustrated in Figure 11. The plot at the top of Figure 11 corresponds to the 1260/1240 band ratio and the plot at the bottom to the 1260/1225 ratio. A linear correlation is apparent between both ratios and the AA data. The correlation equations between DRIFTS band ratios and mg/kg Si by AA are: 1260/1240 1260/1225 Y = 1.001 + (1.195 E-03)X Y = 0.963 + (1.564 E-03)X. More scatter is evident for the 1260/1225 data and is probably due to variability in measurement of a less intense portion of the Amide III band. The lower limit for quantitation by DRIFTS appears to be about 250 mg/kg Si. Background contributions to the DRIFTS ratios interfere at Si concentrations below this point. The relationship between DRIFTS and AA data is linear over the range of mg/kg Si levels available in this study. Converting weight concentration of Si to weight concentration of siloxane polymer, using the calculated molecular weight of the polymer, shows the linear range to be about 680 to 4900 mg/kg polymer on hair. Kubelka-Munk units were used for the correlation plots. A comparison was made of the correlation using absorbance units. In this particular case, absorbance units also pro- duced a linear relationship between DRIFTS band ratio and mg/kg Si by AA. This case
Purchased for the exclusive use of nofirst nolast (unknown)
From: SCC Media Library & Resource Center (library.scconline.org)