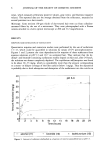
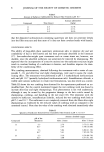
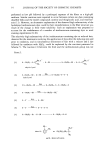
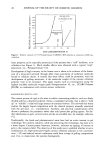
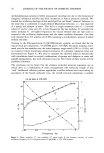
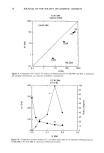
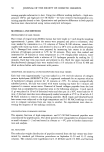
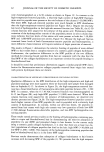
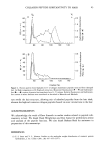
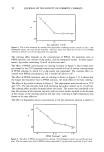
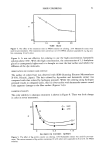
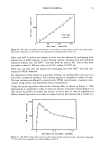
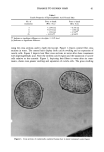
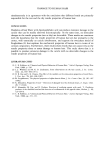
22 JOURNAL OF THE SOCIETY OF COSMETIC CHEMISTS As would be expected, additional information can be obtained by determining the dependence of the above parameters on the oscillatory frequency (8). Intuitively one can predict that as to is increased it will become more and more difficult for the viscous element to respond to the applied strain and that this element will present a progressively increasing mechanical impedance to flow. Thus, in a simple Maxwell model for a viscoelastic material, i.e., a spring and a dash-pot in series, typical behavior would be as follows: at low frequencies G" could dominate over G', but at a critical frequency a crossover will occur. Ultimately G" will fall toward zero as G' continues to rise, i.e., the model behaves progressively as a purely elastic element. The crossover point of G' and G" defines the relaxation time, tr, of the body and is actually the reciprocal of the frequency value at crossover (see Figure 3). A second, somewhat less informative, method to investigate viscoelastic behavior in- volves measuring the stress decay of a viscoelastic body after application of an "instant" strain. In general, some kind of exponential decay is to be expected from which an average relaxation time can be calculated. EXPERIMENTAL First, using data trends of work previously published on Polyquaternium-10 [UCARE Polymer JR400)/SDS, but substituting with the higher molecular weight analog (JR30M)], we examined the high viscosity range preprecipitation region of the hi-com- ponent pair and established that gel structures were indeed formed. We chose a polymer concentration of 1% for most of the work and prepared the desired compositions by mixing equal parts of a 2% polymer solution with a solution of surfac- rant double the final desired concentration. Another qualitative test involved a study of foaming characteristics by a simple shake test. To introduce sufficient fluidity into the 1.0 1.0 q'l •q 0.$ -2 0 2 Ioq {•t r } G"/G Figure 3. Graphs of'q'/'q, G'/G, and G"/G versus log (LOt r) based on the Maxwell model.

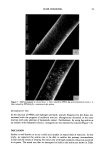
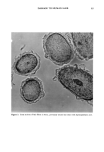
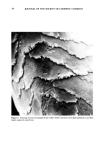
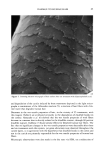
POLYMER/SURFACTANT GELLING STRUCTURES 23 systems, they were diluted fivefold. In preparing compositions for rheological study at the higher polymer concentration, special precautions were necessary to remove all air bubbles entrained during preparation. This generally involved letting the samples stand for at least a day and "deaerating" several times by connecting the containing vessel to a vacuum. Likewise, great care was taken in loading the specimen into the outer cylin- drical element of the rheometer and squeezing it into the annular space between the outer and inner cylindrical elements. Sample preparation for SEM studies was as follows: 1% polymer (JR30M) and 1% polymer with 0.1% surfactant (SDS) solutions were used. Samples were prepared by placing a small amount of each solution on a separate aluminum stub, which is a standard mounting device for SEM examination. One AI stub with the sample was positioned in the bottom of a small flask, and the flask was submerged in liquid N2 until it was frozen, involving a minimum of 5 minutes. The frozen sample was then dried in vacuo for at least 2 hours. The A1 stub carrying the sample was removed from the flask, coated with Au, and examined in the SEM at 20 kV. In keeping with the rationale given above, most of the rheological work was done in the oscillatory mode. The frequency (f) range was 0.001 Hz to 10 Hz, and the parameters G*, G', G" and • were automatically plotted as a function of to (2xf). In the same way, viscosity O'l) and shear stress (x) were plotted for some systems. It was confirmed that the measurements were in the linear range, i.e., where the derived parameters were independent of the strain values chosen. For some of the systems a simple stress relax- ation experiment was carried out. Here the sample was rapidly subjected to a strain and then the decay of stress was monitored periodically over a 20-minute period. EQUIPMENT All rheological measurements were done with the Bohlin VOR Rheometer at room temperature (25øC). The scanning electron microscope used was a Cambridge Model S-250. CHEMICALS The different grades of Polyquaternium-10 cationic cellulosic used, viz., UCARE Polymers JR30M, LR30M, JR400, LR400, and an experimental product, HR 400, are products of Union Carbide Corporation. In this series the suffix refers to an aqueous solution viscosity and therefore is a molecular weight index, with 30 M 400. The designations H, J, and L refer to the degree of cationic substitution (CS) of the cationic cellulosic and follow the sequence H J L. An ethoxylated methyl glucoside qua- ternary was supplied by Amerchol. The surfactants used, together with their suppliers, are as follows: SDS--sodium dodecyl sulfate (EM Industries) SLES-2,3--sodium lauryl diethoxy, triethoxy sulfate (Standapol ES-2, ES-3, Henkel Corp.) SDDBS--so- dium dodecylbezenesulfonate (Pfaltz and Bauer) AOT--dioctyl sodium sulfosuccinate (Aerosol OT, American Cyanamid) CTAB--cetyltrimethyl ammonium bromide (Fluka) sodium salicylate (Aldrich). The polyanion used, viz. CMC--carboxymethyl cellulose, sodium salt (Polysciences)-- was of molecular weight 700,000. RHEOLOGICAL TEST RESULTS It was discovered (9) many years ago that dilute solutions of the surfactant cetyltri-
Purchased for the exclusive use of nofirst nolast (unknown)
From: SCC Media Library & Resource Center (library.scconline.org)