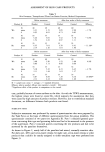
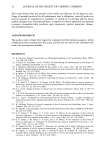
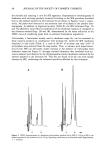
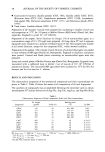
ASSESSMENT OF SKIN CARE PRODUCTS 7 Table III Skin Parameter: Skin Roughness Method: Surfometry (RTM) Before treatment After four weeks of daily treatment Product K Product Control Product Control Efficacy N 22 22 22 22 Schw mean 117.54 115.41 105.27 118.87 s 33.70 33.41 27.75 37.85 N 34 34 31 31 BDF mean 97.49 99.14 92.01 100.00 s 14.13 11.17 10.23 12.24 - 11.4%* --8.0%* Before treatment After four weeks of daily treatment Product N Product Control Product Control Efficacy N 22 22 22 22 Schw mean 118.80 117.84 104.03 113.73 s 35.31 31.25 25.88 26.66 N 33 33 33 33 BDF mean 99.27 102.16 91.45 100.42 s 12.95 14.42 11.56 13.09 -8.5%* --8.9%* N = sample size mean = average s = standard deviation. Efficacy: relative product efficacy ratio (product-control) ß 100/control. ß Highly significant efficacy of the product in comparison to the control (P 0.01). Image analysis (31). The principle consists of measuring shadows, generated by incident lighting of the surface of silicon replicas. Experimental: A negative white pigmented silicone replica is taken of the volar forearm and fixed on a microscope slide. The image analysis is carried out with a microscope. The magnification of 20x illumination under an angle of 25 ø creates shadows of the furrows on the replica. The widths of these shadows are measured all over the image with an image analyzer (IBAS © from Zeiss/Contron, Germany). The replicas are rotated in steps of 30 ø and measured in six directions. The image processing starts by an image input using a black-and-white video camera. Five images are taken and averaged to reduce noise. A shading correction compensates the inhomogenous illumination. After removing all of the blistered structures and discriminating the shadows into a binary image, the width of the shadows is measured all over the image by the parameter chord. The mean of all chords of six directions multiplied by tan 25 ø gives the mean depth of the furrows in microns. Results in Table IV show that significant reductions of skin roughness after the test period could be assessed at both centers for "N" for "K," reductions were smaller and significant only in one center. Transepidermal water loss barrier function Transepidermal water loss (TEWL): Evaporimeter EP 1 © (Servomed, Kinn, Sweden) (32,33) Principle. Measurement of TEWL is used for characterization of the skin's water barrier function. The method is based on the estimation of the water vapor pressure gradient

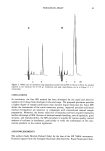
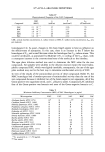
8 JOURNAL OF THE SOCIETY OF COSMETIC CHEMISTS Table IV Skin Parameter: Skin Roughness Method: Image Analysis Before treatment After four weeks of daily treatment Product K Product Control Product Control Efficacy N 33 32 32 32 Schr mean 55.80 54.74 50.87 54.35 s 6.56 6.63 10.68 18.45 N 33 33 33 33 BDF mean 51.70 52.74 47.98 50.81 s 8.93 9.41 6.39 7.84 -6.4% -5.6%* Before treatment After four weeks of daily treatment Product N Product Control Product Control Efficacy N 33 33 33 33 Schr mean 57.50 55.97 47.06 50.54 s 9.80 5.50 7.14 9.39 N 33 33 33 33 BDF mean 51.08 52.23 48.37 52.05 s 8.46 9.87 7.11 7.76 -6.9%* -7.1%* N = sample size mean = average s = standard deviation. Efficacy: relative product efficacy ratio (product-control) ß 100/control. ß Highly significant efficacy of the product in comparison to the control. immediately adjacent to the surface of the skin. The higher the TEWL, the worse the barrier function. The parameter measured is TEWL expressed as g/m 2 h. Experimental. The probehead is positioned directly on the horizontally fixed forearm without using additional pressure. The readings are recorded after a stabilization period of 30-45 seconds. Mean values of three consecutive measurements are taken as the TEWL value. The measurement was performed in three centers. Results are presented in Table V. Product K seems to show a reduction in TEWL, probably due to a certain occlusive effect caused by residues of applied product, with highest values at center Be. The high standard deviations lead to our conclusion that this method does not allow detection of marginal improvements in skin barrier function, which can reasonably be expected in healthy skin. Skin surface lipids Sebumeter SM 810/PC © (Courage & Khazaka GmbH, Ki31n, Germany) (34,35) Principle. The sebumeter measures the casual lipid level on skin by adsorbing it into a turbid plastic film and measuring its transparency. Transparency is proportional to lipid quantity. The sebumeter shows arbitrary units. Experimental. The sebumeter cartridge is pressed against the skin for 30 seconds. The mean values of three recordings per test area are taken as casual lipid values. The measurements were performed in three centers. Results in Table VI show a dramatic increase in sebum levels after treatment in each
Purchased for the exclusive use of nofirst nolast (unknown)
From: SCC Media Library & Resource Center (library.scconline.org)