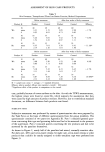
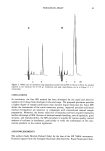
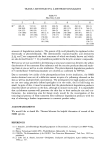
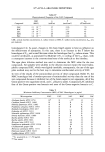
ASSESSMENT OF SKIN CARE PRODUCTS 9 Table V Skin Parameter: Transepidermal Water Loss Barrier Function Method: Evaporimeter Before treatment After four weeks of daily treatment Product K Product Control Product Control Efficacy N 4O 4O 4O 4O We mean 3.21 3.15 2.85 2.90 S 0.95 0.81 0.71 0.82 N 35 35 35 35 He mean 5.46 5.83 5.52 5.74 S 1.54 1.23 0.97 1.11 N 35 35 35 35 Be mean 6.55 7.01 5.70 6.41 S 2.14 2.16 1.61 1.96 - 1.7% -3.8% - 11.1%* Before treatment After four weeks of daily treatment Product N Product Control Product Control Efficacy N 4O 4O 4O 4O We mean 3.08 3.20 3.23 3.08 S 0.86 1.11 0.66 0.69 N 35 35 35 35 He mean 5.18 5.45 6.21 6.45 S 2.11 1.44 1.61 1.27 N 35 35 35 35 Be mean 6.87 6.69 7.29 6.34 S 2.12 2.22 2.06 1.69 4.9% -3.7% 14.98%* N = sample size mean = average s = standard deviation. Efficacy: relative product efficacy ratio (product-control) ß 100/control. ß Significant effect of the product in comparison to the control. case, probably because of cream residues on the skin. As with the TEWL measurements, the highest values were found at center Be, which supports the assumption that they were caused by high amounts of product residues. However, due to tremendous standard deviations, no difference between both products was found. SUBJECTIVE TESTS Subjective assessment was performed by means of questionnaires that were prepared by the Task Force on the basis of different questionnaires from the group members. The questionnaire consisted of two parts (see Appendix II). Part 1 contained general ques- tions concerning skin type and grooming habits and had to be answered in the presence of the supervisors. Part 2 contained queries concerning the test products and had to be answered by the panelists themselves. As shown in Figure 2, nearly half of the panelists had mixed, normally sensitive skin. For daily care, 48% used oil-in-water creams for night care, oil-in-water creams or other products that couldn't be exactly assigned to either emulsion type were preferred (see Figure 3).

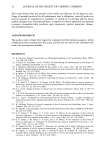
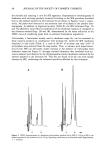
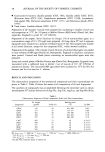
10 JOURNAL OF THE SOCIETY OF COSMETIC CHEMISTS Table VI Skin Parameter: Skin Surface Lipids Method: Sebumeter Before treatment After four weeks of daily treatment Product K Product Control Product Control Efficacy N 3O 3O 3O 3O R mean 1.13 1.02 1.97 0.73 * S 1.11 1.39 3.01 0.94 N 35 35 35 35 Be mean 0.90 0.91 20.30 1.12 * S 0.96 0.77 15.31 0.77 N 22 22 22 22 Schw mean 1.06 1.08 11.03 1.06 * S 1.83 1.38 12.94 1.11 Before treatment After four weeks of daily treatment Product N Product Control Product Control Efficacy N 3O 3O 3O 3O R mean 0.83 0.93 1.60 0.53 * S 1.21 1.60 3.87 1.01 N 35 35 35 35 Be mean 1.20 0.76 13.88 0.89 * S 1.49 0.79 15.50 0.65 N 22 22 22 22 Schw mean 1.03 0.98 12.80 1.48 * S 1.10 1.02 12.44 3.51 N = sample size mean = average s = deviation. * Data shows only single events of increased sebumeter values due to product residues on the skin. Therefore, an effect on skin surface lipids is not available. la: Skin-Type 1 b: Skin-Sensitivity mixed 45,2 % normal 55,0 % ... greasy 1,0 % normal 17,7 % none 8,0 % 36,2 % Figure 2. Distribution of skin types and skin sensitivities. 37,0 % The panelists of the 11 centers assessed spreadability on skin on a 5-grade scale (1 = very good 5 = very bad), with a medium grade of 2.4 for "N" and 3.3 for "K," as shown in Figure 4. There exists a fair correlation between the test centers. Assessment
Purchased for the exclusive use of nofirst nolast (unknown)
From: SCC Media Library & Resource Center (library.scconline.org)