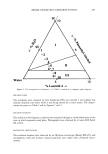
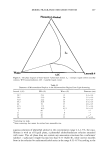
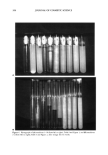
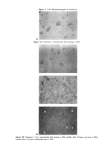
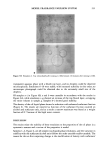
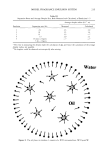
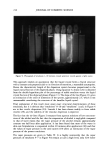
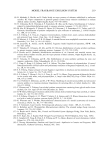
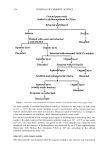
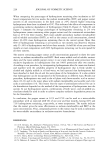
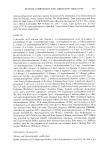
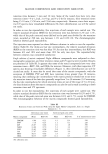
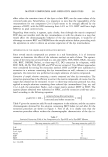
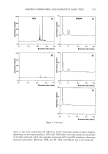
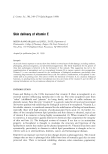
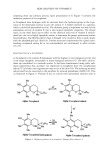
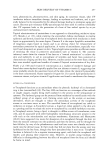
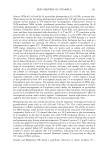
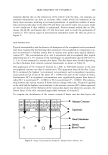
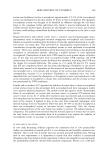
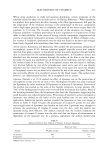
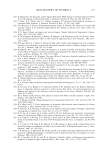
MODEL FRAGRANCE EMULSION SYSTEM 205 ! 90 ,' lO Water o o\ø 95 x2 x3 4 5 II 6 x x8 III 9x•10 5 10 % Laureth 4 Figure 1. The composition of emulsions 1-10, Table I, marked on a triangular phase diagram. EMULSIFICATION The emulsions were prepared by first dissolving PEA into laureth 4 and adding this solution dropwise into water while it was being stirred by a vortex mixer. The compo- sitions are given in Table I and in Figures 1 and 2. EMULSION STABILITY The stability of the fragrance emulsion was examined through a visual observation of the time in which separation took place. Photographs were obtained by a Canon EOS Rebel XS camera. MICROSCOPIC OBERVATIONS The emulsion droplets were observed by an Olympus microscope (Model BHA-P), and microphotos, with and without crossed polarizers, were taken with a Polaroid micro- camera.

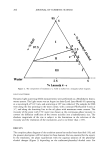
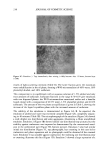
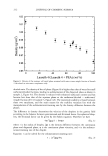
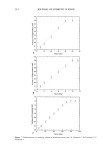
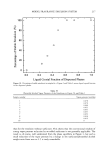
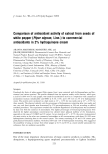
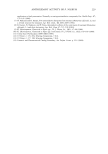
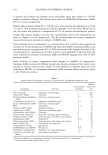
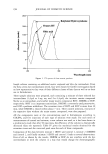
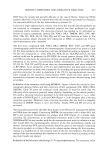
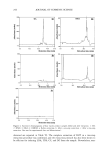
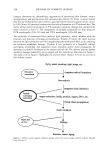
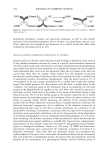
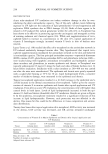
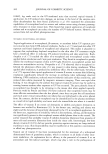
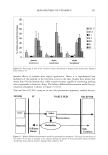
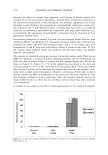
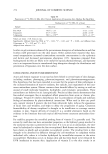
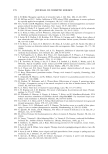
206 JOURNAL OF COSMETIC SCIENCE 95 ,' 5 Water 0 ø\ø 97.5 ½, III ! 2.5 5 % Laureth 4 -• Figure 2. The composition of emulsions a-j, Table I, marked on a triangular phase diagram. LIGHT SCATTERING Dynamic light-scattering (DLS) measurements were performed on a Brookhaven Instru- ments system. The light source was an Argon ion laser (Lexel Laser Model 85) operating at a wavelength of 514.5 nm, and scattering at 90 ø was collected. The samples for DLS were along the line pointing to the water corner, with a constant PEA/laureth 4 ratio at 3:7, and along the demixing line in the oil phase with maximum water content. The viscosity of the point with 15% water was chosen as the continuous-phase viscosity to convert the diffusion coefficient of the inverse micelies into a hydrodynamic size. The absolute magnitude of the size is subject to the limitations in the selection of the viscosity and the resolution of the instrument, and is no better than + 15%. RESULTS The complete phase diagram of the emulsion system has earlier been described (19), and the present description will be limited to those features that are essential for the report. In the emulsions, the phase equilibrium with the aqueous solution of the phenethyl alcohol changes (Figure 3) depending on the surfactant/phenethyl alcohol ratio. For
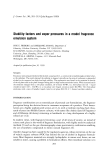
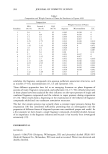
Purchased for the exclusive use of nofirst nolast (unknown)
From: SCC Media Library & Resource Center (library.scconline.org)