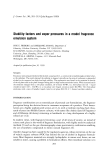
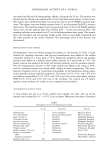
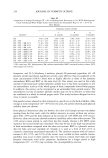
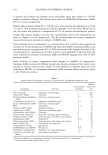
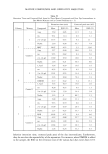
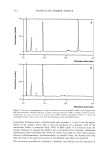
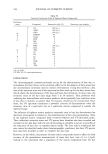
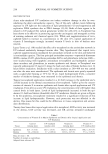
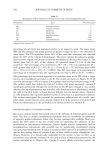
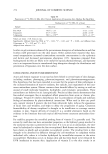
MATRIX COMPOUNDS AND OXIDATIVE HAIR DYES 239 Table IV Retention Times and Corrected Peak Areas for Three Matrix Compounds and Four Dye Intermediates in D•,e-Matrix Mixtures and in Control Solutions (n = 5) Retention time (min) Corrected peak area (AU) Column Mixture Compound Mean RSD (%) Mean RSD (%) 4-ap 5.59 0.85 11.5 7.2 res 9.31 1.14 0.3 3.1 1 2-n-l,4-pd 13.75 0.53 9.1 21 NaAsc 2.18 0.38 54.7 7.8 1 BHT 38.07 • 0.55 2.5 19.0 4-ap 5.57 0.40 10.6 5.9 res 9.55 0.82 0.3 5.0 Control 1 2-n-l,4-pd 13.89 0.50 10.0 6.5 NaAsc 2.18 0.21 56.5 8.0 1,4-pd 5.36 0.39 14.6 1.6 res 8.32 0.34 0.5 2.9 2 2-n-l,4-pd 12.91 0.55 14.4 1.1 NaAsc 2.35 0.60 70.3 2.3 2 DMDM 6.72 0.42 5.4 15.1 .......... 1,4-pd 5.33 0.19 15.0 2.0 res 8.28 0.53 0.5 1.3 Control 2 2-n-l,4-pd 13.28 3.39 14.4 3.8 NaAsc 2.35 0 80.7 1.5 4-ap 5.99 0.39 22.1 1.7 res 9.53 0.79 0.6 1.5 3 2-n-l,4-pd 14.09 0.39 20.4 1.6 NaAsc 2.27 0.25 35.7 5.5 3 EOP 36.05 0.71 6.4 0.6 4-ap 6.32 0.88 22.7 2.0 res 10.26 1.99 0.6 5.9 Control 3 2-n-l,4-pd 14.84 1.42 20.3 1.6 NaAsc 2.24 0.24 53.2 6.3 behavior (retention time, corrected peak area) of the dye intermediates. Furthermore, they do not alter the repeatability of the separation. For instance, when DMDM is added to the sample, the RSD on the retention time of the various hair dyes varies from 0.3%

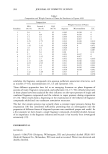
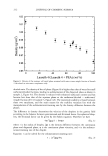
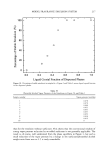
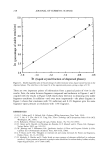
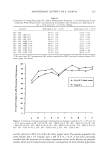
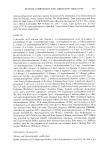
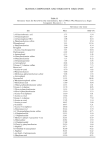
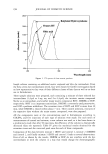
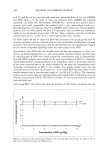
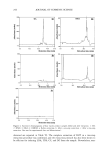
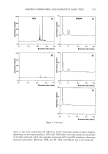
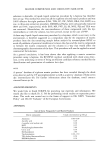
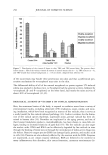
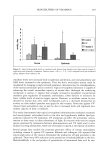
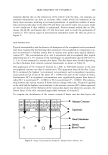
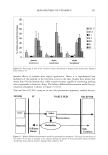
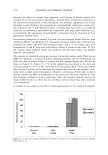
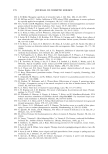
240 JOURNAL OF COSMETIC SCIENCE to 0.5% and that of the corrected peak areas stays below the limit of 5%. For DMDM, this RSD value is of the order of what was obtained when DMDM was analyzed separately (see Table III). Nevertheless, DMDM has a retention time greater than 5 minutes and could (potentially) be confused with a dye intermediate (such as p- phenylenediamine, for instance). However, DMDM, which shows two chrornatographic peaks at 220 nm with exactly the same UV spectrum, does not show any absorbance signal at any wavelength greater than 250 nm. Thus, a selective detection of the dye intermediates can be cacried out at a wavelength greater than 250 nm. For EOP, Tables III and IV show that EOP has a retention time much greater than 30 minutes, and thus cannot be confused with any dye intermediate. Furthermore, the peak retention times and the peak areas of the dye intermediates are not significantly changed by the matrix compound regarding either the mean values or the RSD. Nevertheless, since EOP does not interfere with the hair dye separation in these con- ditions, an additional parameter, i.e., the concentration, has been checked. A broad range of concentrations of EOP were tested around the concentration used in formulations. Five RP-HPLC analyses were carried out for each concentration of EOP in a three-dye intermediate solution containing NaAsc as an antioxidant. Figure 2 shows the evolution of the mean corrected area of the peaks obtained for the three dye intermediates with increasing concentration of EOP in the sample. The graphs clearly show that the corrected areas do not vary significantly (p -- 0.05) when EOP has been added to the sample solution over a concentration range of 2 g/100 g-10 g/100 g. The statistical analysis of the results (data not reported) shows good repeatability of the analysis for each selected concentration of EOP. The RSD is less than 5% for the retention time and the corrected peak area. Concerning BHT, the results show that the presence of this matrix compound does not 25t • *T 4-ap • -, T • 2-n-l,4-pd ! ,,a. ß :0 't -- .. . 10 0 2 4 6 8 10 Concentration of EOP (g/100g) Figure 2. Influence of the concentration of EOP on the corrected peak areas of 4-ap, res, and 2-n-l,4-pd. (See text for experimental data and abbreviations.)
Purchased for the exclusive use of nofirst nolast (unknown)
From: SCC Media Library & Resource Center (library.scconline.org)