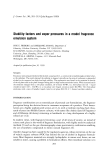
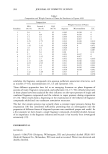
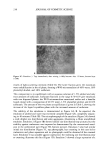
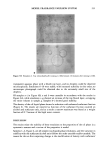
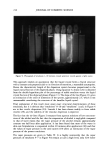
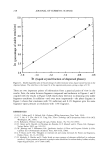
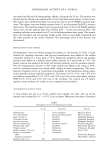
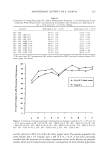
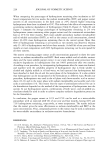
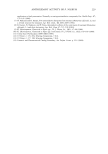
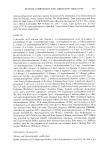
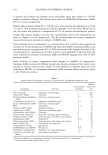
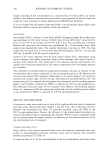
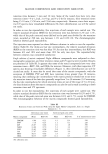
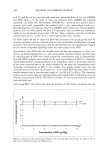
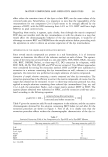
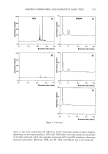
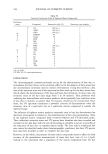
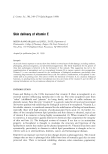
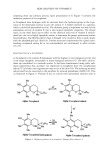
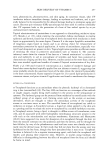
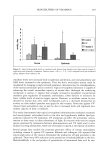
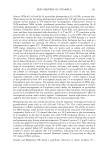
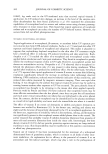
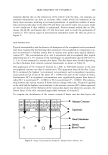
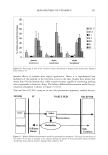
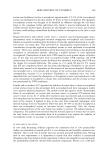
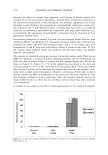
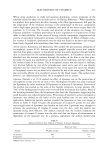
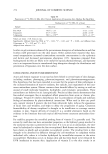
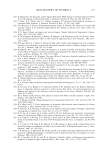
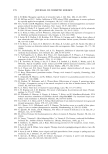
MODEL FRAGRANCE EMULSION SYSTEM 211 D Figure 5D: Emulsion 4. Top: immediately after mixing (x 100) bottom: 10 minutes after mixing (x 100). transparent aqueous phase with a bluish top layer, and no droplets could be observed microscopically. Emulsions 6-10 were stable, with increased turbidity in this order no microscopic photograph could be obtained due to the extremely small size of the droplets. Of samples a-j in Figure 4B, a and b were unstable in accordance with the results in Figure 4A, while emulsions c-g showed an increase of the top bluish layer, occupying the entire volume in sample g. Samples h-j showed good stability. The density of the oil liquid phase showed a reduction with enhanced surfactant fraction (Figure 6). The results are reported as function of the surfactant fraction counted on alcohol and surfactant only, and as a result a narrow maximum was found at a weight fraction of 0.7 because of the high water content. DISCUSSION The results relate the stability of these emulsions to the properties of the oil phase in a systematic manner and a review of the properties is useful. Samples 1-4, Figure 4, are all simple two-(liquid)-phase emulsions, and the variation in stability with the surfactant/alcohol ratio follows the order unstable-stable-unstable. The reason for this at-first surprising change is the modification of density with surfactant/

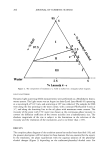
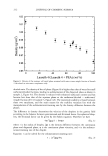
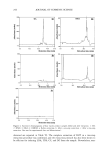
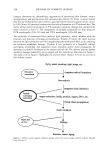
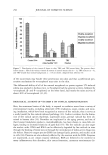
212 JOURNAL OF COSMETIC SCIENCE 1.02 1.01 1.00 0.99 0.98 0.97 0.96 I ' I ' I ' I ' I ' I 0.95 I • I I I I I • I 0 20 40 6o 80 lOO Laureth 4/(Laureth 4 + PEA) (wt %) Figure 6. Density of the isotropic oil liquid phase saturated with water versus weight fraction of laureth 4 calculated on non-water components only. alcohol ratio. The density of the oil phase (Figure 6) is higher than that of water for small surfactant/alcohol fractions, leading to sedimentation of the dispersed phase as shown in sample 2, Figure 4A. The density is reduced with enhanced surfactant content and has become less than that of the aqueous phase at the surfactant/(alcohol + surfactant)/ weight fraction of 0.32 (sample 3, Figure 4A). The maximum stability is found between these two emulsions, and the main reason for the stability variation lies with the manipulation of the sedimentation/creaming rate by the density difference between the phases. The difference in density determines the velocity of the droplets in the gravity field according to the balance between gravitational and frictional forces. For spherical drop- lets, the frictional factor can be given by the Stokes equation. Therefore we have 4q'rr3Apg/3 = 6q'rxlrv (Eq. 1) where r is the radius of droplet, Ap is the density difference between the continuous phase and dispersed phase, x I is the continuous phase viscosity, and v is the sedimen- tation/creaming rate of the droplet. Equation 1 can be solved for the sedimentation/creaming rate: v = 2r2Apg/9xl (Eq. 2)
Purchased for the exclusive use of nofirst nolast (unknown)
From: SCC Media Library & Resource Center (library.scconline.org)