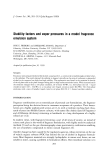
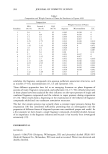
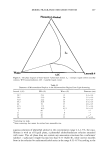
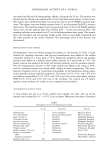
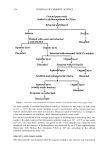
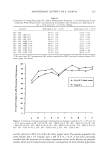
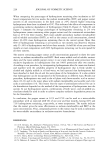
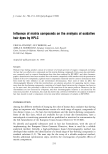
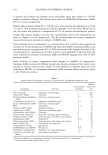
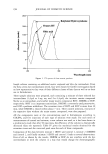
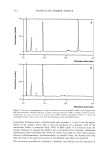
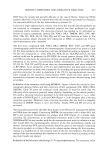
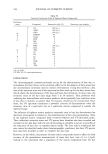
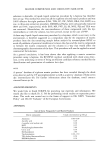
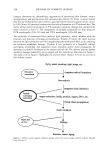
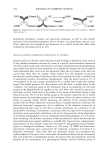
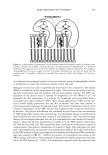
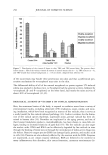
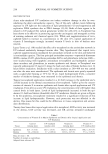
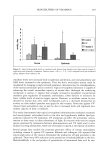
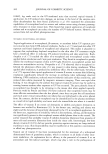
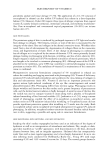
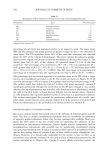
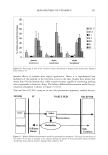
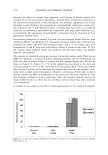
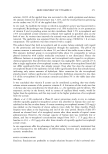
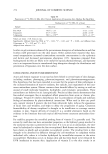
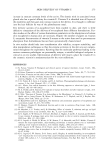
SKIN DELIVERY OF VITAMIN E 267 8O 70 t 50- 3o 10 0 , gamma alpha to½otrienol to½otrienol alpha tocopherol I,i SC1 sc 2 E1 E2 PD Figure 10. Percentage of each of the vitamin E forms distributed in biopsies from mouse skin. Adapted form reference 97. harmful effects of sunlight after topical application. Hence it is hypothesized that hydrolysis of the prodrug to the free form occurs in the skin. Studies have shown that mouse skin (99) and human skin (100) contain esterases capable of converting prodrug ester compounds to bioactive drugs. The bilayer diffusion/bioconversion model for per- cutaneous absorption is shown in Figure 11 (101). Tojo and Lee (102,103), using an i, vitro skin permeation apparatus, studied the per- DONOR SC VIABLE SKIN RECEPTOR onversion Sink Condition ß Reservoii • -- Diffusion Barrier Figure 11. Bilayer diffusion/bioconversion model for percutaneous absorption. The drug concentration on the surface of the skin is assumed to be constant during the period of skin penetration (skin-controlled transdermal drug delivery system). Adapted from reference 103.

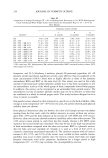
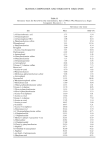
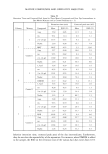
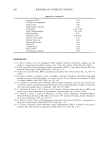
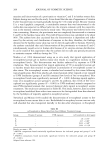
268 JOURNAL OF COSMETIC SCIENCE meation and bioconversion of a provitamin to vitamins C and E in hairless mouse skin. Infinite dosing was used for the study. It was found that the rate of appearance of vitamin E after bioconversion increased gradually during the 72-h study period. Because vitamin E is a very lipophilic compound, a considerable amount that was bioconverted in the viable skin was expected to diffuse back into the stratum comeurn until the concentra- tion in the stratum comeurn reached a steady state. This process was believed to be very time-consuming. However, the provitamin was not completely bioconverted to vitamins C and E in the hairless mouse skin. The yield of bioconversion was calculated to be about 96%. The authors have also cautioned that the bioconversion is dependent and influ- enced by the activity and distribution of enzymes in the skin therefore, the findings obtained in the hairless mouse skin may not be directly applicable to humans. However, the authors concluded that such bioconversion of the provitamin to vitamins E and C simultaneously would occur in human skin because of its enzyme esterase distribution. It can be stated of this experiment that the authors did not take any special precautions to maintain enzyme viability during the 72 h. Norkus et •L (104) demonstrated using an i, vitro study that topical application of ot-tocopheryl acetate gel to hairless mouse skin results in a significant increase in free ot-tocopherol levels. This bioconversion was further enhanced by exposure to UVB irradiation. They demonstrated that topical application of 5% ot-tocopheryl acetate gel to hairless mouse skin resulted in significant accumulation of ot-tocopheryl acetate in skin tissue. The ot-tocopheryl acetate is absorbed and retained by skin tissue following topical application. Skin from placebo gel-treated animals either exposed or not exposed to UVB irradiation (groups A and B) contained low levels of free ot-tocopherol. Skin ot-tocopherol levels were significantly increased (P 0.001) following topical applica- tions of ot-tocopheryl acetate (groups C and D). In addition, skin levels of free ot-to- copherol are significantly greater (P 0.001) in UVB-irradiated animals compared to non-UVB-irradiated animals that received identical daily topical ot-tocopheryl acetate treatments. The results are summarized in Table III. This study, however, does not allow ot-tocopherol mobilized from other tissue sources to be distinguished from that obtained by the hydrolysis of topically applied ot-tocopheryl acetate. Trevithick and Mitton (105) studied the bioconversion of ot-tocopheryl acetate to free ot-tocopherol across mouse skin in vivo. Radiolabeled ot-tocopheryl acetate was not only well absorbed but also transported laterally in the skin after absorption. ot-Tocopheryl Table III c•-Tocopherol in Mouse Skin From Four Different Treatment Groups Group Vitamin E acetate UVB exposure o•-Tocopherol in skin (pg/g) A - - 2.8 _+ 0.54 • B - + 4.15 _+ 0.86 • C + - 19.91 + 2.68 b D + + 34.01 _+ 14.38 Results are mean _+ SD. • ANOVA comparisons found statistically significant between the indicated groups and groups C or D (P 0.001). b ANOVA comparisons found statistically significant between the indicated groups and group D (P 0.001). Adapted from reference 104.
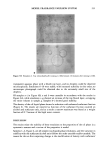
Purchased for the exclusive use of nofirst nolast (unknown)
From: SCC Media Library & Resource Center (library.scconline.org)