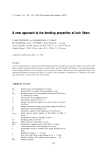
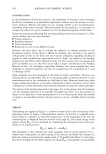
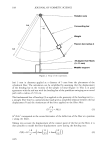
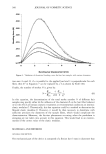
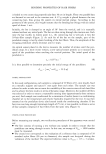
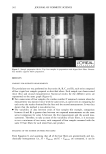
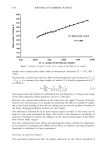
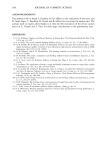
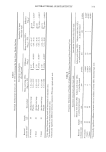
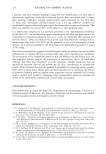
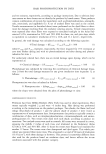
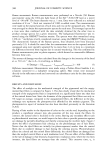
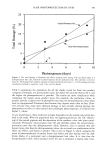
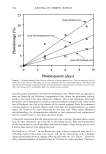
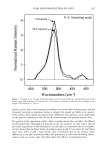
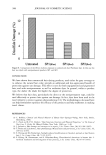
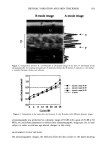
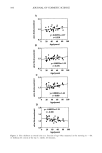
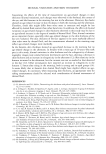
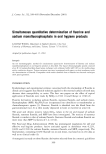
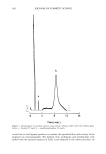
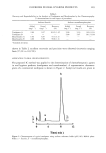
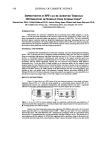
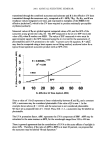
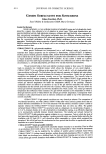
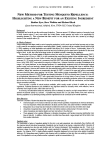
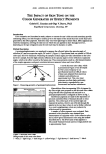
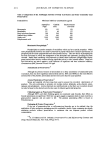
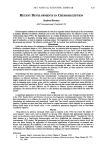
DIURNAL VARIATION AND SKIN THICKNESS 393 D B-mode image G A-mode image s Figure 1. Comparison between A- and B-modes of ultrasound image of the skin. P: membrane of the ultrasound probe. G: coupling ultrasonic gel. E: epidermal entry echo. D: dermis. S: subcutis. x: skin surface. y: interface between dermis and subcutis. • 1o0' • dynamdBdB3040rangerange 0.9' •- dynamic • •__ dynamic range 50 dB 0.8 ..... A-mode • 0.7 . ß i ß i ß ß i ' i i ß 0 4 8 12 16 20 24 28 Gain(riB) Figure 2. Comparison in the same skin site between A- and B-modes with different dynamic ranges. ultrasonography was performed in a dynamic range of 30 dB with a gain of 20 dB at 30 MHz, we used those parameters to obtain three ultrasonographic images per site in each subject in order to evaluate age-related changes in this study. MEASUREMENT OF SKIN THICKNESS On ultrasonographic images, the thickness from the skin surface to the plane showing

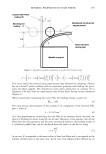
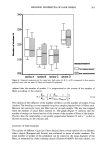
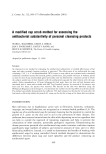
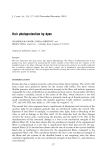
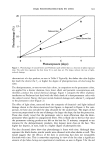
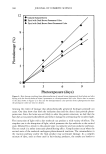
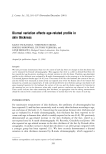
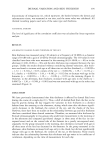
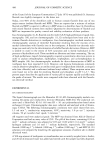
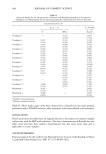
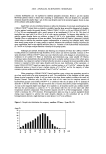
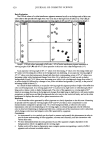
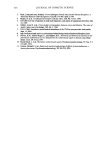
394 JOURNAL OF COSMETIC SCIENCE A B C ß ß y= 0.00291x+1.37 r= 0.310 0.5 ......... 0 20 40 60 80 100 Age(years) 2.5[ ß ß 1.5 [ r= 0.276 0.5' ......... 0 20 40 60 80 100 Age(years) [ y= 0.00381x+1.44 0.5[ . , r=0.483 0 20 40 60 80 100 Age(years) D 2-0 t y= -0.00221x+1.19 r=-0.308 0.5 0 20 40 60 80 100 Age(years) Figure 3. Skin thickness at several sites as a function of age when measured in the morning (n = 40). A: forehead. B: corners of the eye. C: cheeks. D: forearms.
Purchased for the exclusive use of nofirst nolast (unknown)
From: SCC Media Library & Resource Center (library.scconline.org)