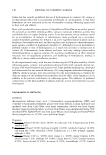
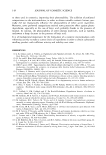
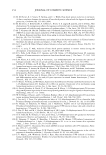
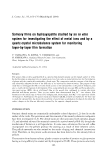
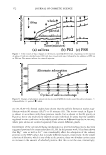
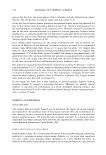
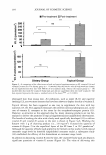
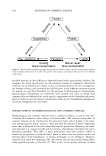
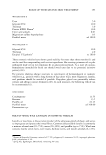
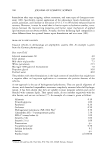
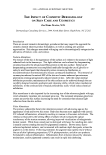
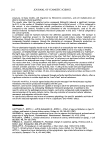
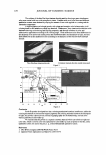
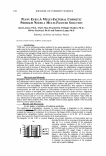
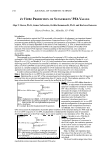
166 JOURNAL OF COSMETIC SCIENCE Mucin 2-Aminoethanethiol + + WNJS WNJS WNJS .L:IF = -K · .L:lm WNJS WIN s ....___ ___ f Quartz ______ _ Gold electrode Frequency counter .L:IF: frequency shift .L:lm : mass change K: constant Figure 1. Schematic representation of mucin-coated quartz-crystal microbalance (QCM) used for the investigation of pellicle accumulation. were deposited so that a frequency decrease of 1 Hz corresponded to a mass increase of 1 ng on the electrode. The gold electrode surface was modified with 2-aminoethanethiol hydrochloride (5 mmol/1) (Kanta Chemicals, Japan) for ten minutes. Details about this treatment have been described elsewhere (27 ,28). As a starting material for the accu mulation of the salivary protein, a commercially available material would be preferable to the other salivary components. Therefore, one side of the electrode was treated with pig-stomach mucin (0.2%, pH 7) (Waka Pure Chemical Industries, Japan) for ten minutes. The mucin is a general term for many types of glycoproteins secreted from several organs and is also one of the constituents of the tooth pellicle (29). The long-term stability of the QCM frequency over several hours was within ± 2 Hz. All experiments were carried out in an air-conditioned room at a temperature of 24 ° C. In a typical experiment, the mucin-coated electrode was immersed in distilled water (500 ml), and the frequency change caused by the injection of saliva (5 ml) was moni tored while stirring with a magnetic stirrer. To investigate the surface charge of the adsorbed materials on the electrode, PEI (30% polyethyleneimine P-70 solution, Waka Pure Chemical Industries, Japan) and PSS (sodium polystyrene sulfonate, Sigma, USA), which were supposed to give a positive and negative charge, respectively, on the surface, were added to the water as reference substances. RESULTS IN SITU FORMATION OF SALIVARY FILM ON HAP DISKS After collecting periods from 0.2 to 120 minutes in the mouth, the HAP disks were rinsed with distilled water and allowed to dry in the air for ten minutes. The pellicle-like

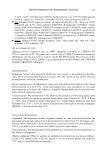
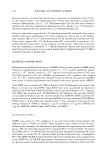
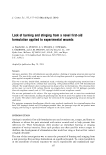
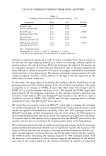
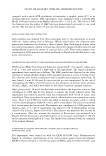
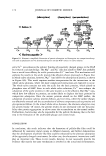
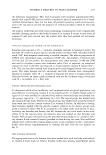
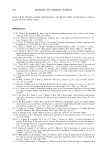
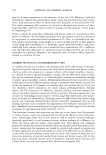
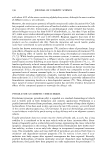
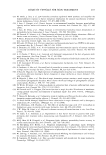
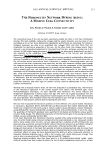
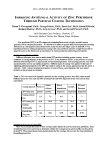
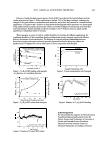
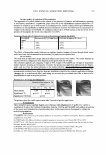
STUDY OF SALIVARY FILMS ON HYDROXYAPATITE 167 film was too _small and no visible adsorbed material was observed. The IR spectra were recorded for the 800-2000 cm- 1 spectral region, as shown in Figure 2. The spectra showed the existence of amide I and II in the regions around 1,650 and 1,550 cm-1, respectively, besides the large background from HAP. The band at_around 1250 cm- 1 , probably due to the sulphate groups, was also observed. The film formation was found to depend on each individual and the collecting time. The signals of amides gradually increased with time for individual A, but no remarkable changes were observed for individual B. The results have shown that the proteins secreted from salivary glands adsorb on the HAP surface to form the pellicle-like film, and these observations mostly coincide with the results by the previous researchers (16,30-34). The adsorbed materials on the HAP disks for individual A were also analyzed using XPS. Table I summarizes the results, showing atomic concentrations of the detected elements at each collecting time. The elements of Ca, P, and O drastically decreased for the treated HAP samples, whereas -rhe other elements increased, suggesting that almost the entire area of the analyzed HAP surface was covered with pellicle-like film. The composition of HAP just soaked in distilled water for 120 minutes, though not shown here, was almost identical to that of the original HAP (O minute). The formation of the pellicle like film was found to be a fairly rapid process as compared with previous reports (10,16,30-34), reaching an apparent saturation level within 0.2 minutes. There was only a little difference among the samples treated for different periods, and no significant differences among three individuals, though the data are not shown here. These phe nomena are in contrast with the IR results in Figure 2, and are largely a result of the difference in analysis depths of these two techniques, that is, the thickness of the film must be beyond the XPS analysis depth. The surface compositions of treated HAP samples were different from that of dried saliva, that is, more N, Si, and S and less Ca, HAP {A} 2000 1600 1200 800 W avenumbers(cm· 1) Figure 2. ATR-FT-IR spectra of HAP surfaces exposed to the saliva in the mouth, obtained from two individuals (A,B) at different periods, and untreated HAP (C). a: 30 b: 60 c: 120 minutes.
Purchased for the exclusive use of nofirst nolast (unknown)
From: SCC Media Library & Resource Center (library.scconline.org)