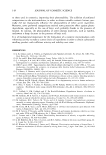
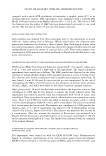
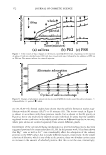
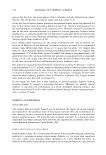
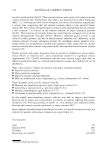
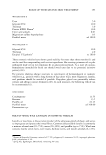
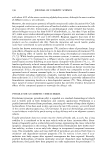
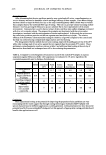
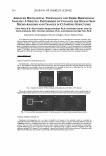
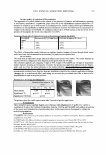
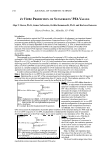
168 JOURNAL OF COSMETIC SCIENCE Table I Chemical Constituents of HAP Disk Surfaces Obtained from XPS Analysis (atomic%) Time (min) Ca p 0 C N Si s Na Cl 0 10.2 7.9 30.9 50.1 0.7 0.2 0 0 0 0.2 0.5 0.6 15.7 74.4 7.3 0.6 0.5 0.2 0.2 5 0.8 0.9 18 69 10.7 0.5 0.2 0.1 0 30 0.5 0.4 18.7 69.3 9.4 1.6 0.2 0.1 0.2 60 0.2 0.2 14.5 74.1 8.8 1.5 0.3 0.2 0.2 120 0.3 0.3 15.6 72.4 9 1.8 0.5 0.1 0 Dried saliva 0.8 0.9 16.2 75.1 5.3 0.5 0.1 0.4 0.8 Samples are the same as in Figure 3. P, Na, and Cl for the treated HAP samples, indicating the preferential adsorption of saliva in the early stage. Elements like N and S can be attributed to the protein of human oral origin, though the contribution of non-protein nitrogen such as urea, uric acid, and amino acids to nitrogen content should also be considered. The narrow scan spectra of Ols, Nls, Cls, and Si2p for the films formed during periods of 0.2 to 120 minutes are shown in Figure 3. The Cls line at 284.6 eV, attributed to hydrocarbon, was used for charge correction. The numbers attached to each spectral curve indicate the values of binding energies at the top of the spectral peaks. The Ols spectrum at O minute came from HAP itself. The large spectral shift of Ols for treated HAP has suggested that the analyzed HAP surface area was almost totally covered with pellicle-like film. In accordance with the previous study (17), the increase in the Nls Ols Nls Cls Si2p 535 531 527 404 400 396 290 286 282 107 103 99 Binding energy(e V) Figure 3. XPS narrow scan spectra (Ols, Nls, Cls, Si2p) of HAP surfaces exposed to the saliva in the mouth at different exposure times. a: O b: 0.2 c: 30 d: 120 minutes. Samples are the same as in Table I.

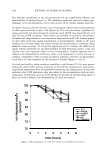
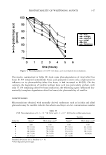
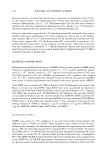
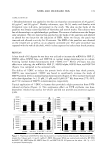
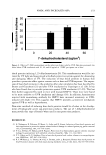
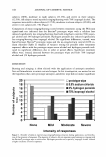
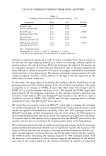
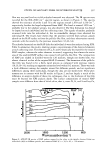
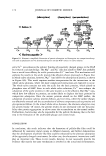
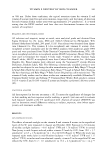
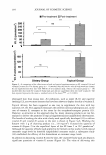
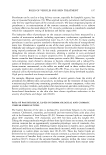
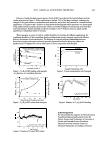
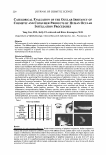
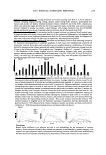
STUDY OF SALIVARY FILMS ON HYDROXYAPATITE 169 signal must be mostly responsible for the adsorption of proteins. The Cls shoulder peaks at around 287 eV arise from the carbonyl carbon. The Si2p binding energy value obtained here agrees with that of the silicates (35). QUANTITATIVE ANALYSIS OF IN VITRO-ADSORBED PROTEIN ON HAP The use of HAP disks is suitable in terms of similarity to the tooth surface, but is considered impractical for quantitative study due to the insufficient surface area for interaction. Therefore, the experiments were carried out with HAP powder for the quantitative analysis of the adsorbed proteins. The in vitro adsorption of salivary proteins on HAP powder was monitored for 120 minutes. Albumin, one of the constituents of saliva, was also used as a reference material. The time-dependent changes in the adsorp tion of both proteins are brought together for comparison in Figure 4. The initial concentration of albumin was 3,000 µg/15 ml, the saliva was diluted with the same volume of distilled water, and the amount of HAP was 30 mg. The maximum amount of adsorbed albumin (270 µg/30 mg HAP) was reached after 90 minutes, and no further increase was observed. Similarly, the adsorption plateau was observed for the saliva, although the saturation level obtained was a little lower. Next, the effect of the albumin concentration on the adsorption behavior at the collecting time of 90 minutes was investigated and is shown in Figure 5(a). The amount of adsorbed albumin reached saturation level at a concentration of around 5,000 µg/15 ml. The corresponding data for saliva are shown in Figure 5(6), where a similar pattern was obtained. The effects of Na+, Mg2+, and Ca2 + ions on the adsorption of protein were investigated, and the results at the reaction time of 90 minutes are shown in Figure 6(a) for albumin and in Figure 6(6) for saliva. Excess amounts of those cations were added to accelerate the interactions and to investigate the mechanism, though the contents of those cations in original saliva collected in the present experiments were 0.001-0.003 mol/1. The addition of each cation caused an increase in the amount of adsorbed albumin, and the Ca2 + ions showed the most significant effect. The maximum amount of adsorbed protein was reached at about 0.1 mol/1 of the cations, and then there was a gradual decrease. This was not the case, however, for the saliva in Figure 6(6). The Ca2 + ions exhibited 300 250 200 150 100 50 0L..J------------------------ 0 20 40 60 80 Reaction time(min) 100 120 Figure 4. Amount of protein adsorbed on HAP powder from the albumin solution and saliva as a function of time over periods varying from zero to 120 minutes. 0: albumin, D: saliva.
Purchased for the exclusive use of nofirst nolast (unknown)
From: SCC Media Library & Resource Center (library.scconline.org)