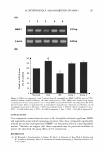
282 JOURNAL OF COSMETIC SCIENCE DQ collagen substrates had an absorption maximum at -495 nm and a fluorescence emission maximum at -515 nm in a LS55 fluorescence microplate reader (Perkin Elmer, USA). For all the MMPs tested, the activities under these conditions were linear for at least 15 min. Each time point was corrected for background fluorescence by subtracting the values derived from the non-enzyme control. CULTURE OF HUMAN DERMAL FIBROBLASTS Human dermal fibroblasts (HDFs), isolated from human neonatal foreskin, were pur chased from Modern Tissue Technologies Inc. (Korea). HDF were maintained in Dul becco's modified Eagle's medium/Ham's F-12 nutrient mixture (DMEM/F-12 3:1, v/v, Sigma) supplemented with 10% heat-inactivated fetal bovine serum (FBS), penicillin (100 IU/ml), and streptomycin (100 µg/ml). HDFs were grown at 37°C in a CO2 incubator. Fibroblast cultures were sub-cultured by trypsinization and used between the sixth and tenth passages. UV A IRRADIATION HDFs (1.5 x 10⁵ cells/ml) were seeded into 35:p plates (Corning Inc., USA) and cultured overnight. Prior to irradiation, when cells were subconfluent, they were washed twice with phosphate-buffered saline (PBS). UVA simulator (F15T8.BLB, Sankyo Denki, Japan), filtered for the emission of UVA (320-400 nm), was used at a tube-to-target distance of 15 cm. The dose of UV A radiation, determined with a UV radiometer (International Light Inc., USA) was set at 6.3 J/cm2 • During irradiation, control cells were treated identically, except for exposure to UV light. After irradiation, fresh serum free medium, with or without samples at different concentrations, was added to cells at 3 7°C for 24 h. RNA ISOLATION AND RT-PCR RNA was extracted using an RNeasy Mini Kit (Qiagen, Germany) according to the supplier's instructions. First, a reverse-transcriptase polymerase chain reaction (RT-PCR) was performed to synthesize cDNA using an Omniscript RT-PCR Kit (Qiagen, Ger many) according to the manufacturer's instructions. PCR was then performed with each cDNA of MMP-1, �-actin fragments, primers, and Tag DNA polymerase. The primers used were as follows: MMP-1: sense 5' -AAAGGGAATAAGTACTGGGC-3', antisense 5'-AATTCCAGGAAAGTCATGTG-3' �-actin: sense 5'-ATGCAGAAGGAGAT CACTGC-3 ', antisense 5 '-CTGCGCAAGTTAGGTTTTGT-3'. The primer sets yielded PCR products of 237 and 248 bp for MMP-1 and �-actin, respectively. Reac tions were carried out in an automatic heat-block DNA thermal cycler (ASTEC PC801, ASTEC Inc, Japan). Denaturation, annealing, and elongation were carried out at 94°C, 50°C, and 72°C for 30 s, 30 s, and 60 s, respectively, for 25 cycles. Electrophoresis of the PCR products was performed on a 1.5% agarose gel in TAE (40 mM Tris acetate, 1 mM EDTA) containing 1 mg/ml ethidium bromide. The level of each mRNA gene expression was expressed as the ratio of the intensity of each PCR gene product to the corresponding �-actin PCR product as a reference molecule for the measuring of mRNA stability and normalized to the control sample.

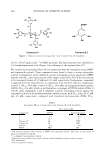
M. HETEROPHYLLA AND INHIBITION OF MMP-1 283 ENZYME-LINKED IMMUNOSORBENT ASSAY (ELISA) The expression level of MMP-1 was determined by the ELISA method as described previously (11). Briefly, after incubation for 24 h, the supernatants of UV-irradiated cultures were transferred to a 96-well plate, and coating buffer (Na2CO 3 1.59%, NaHCO 3 2.93%, NaN 3 0.20%, MgC12 1.02%, pH 9.6) was added at the same volume and incubated for 24 h. The coated wells were washed with PBS containing 0.05% Tween 20 (PBS-T), followed by blocking with 3% BSA in PBS-T for 1 h at 37°C. After washing the wells, 0.3 µg/ml of a monoclonal anti-MMP-1 antibody in PBS-T was added to each well and incubated for 60 min. After washing the wells, 0.2 µg/ml of goat anti-mouse IgG conjugated with alkaline phosphatase in PBS-T was added and incu bated for 60 min. After washing the wells, 100 µl of 1 mg/ml p-nitrophenyl phosphate (pNPP) in a diethanolamine buffer was added for 30 min. The optical density was measured at 405 nm using an automated microplate reader. Finally, the cytotoxicity of the supplemented samples was measured by the MTT assay (12). STATISTICAL ANALYSIS All experiments were performed in triplicate. Data were presented as mean±standard deviation (SD). Experimental results were statistically analyzed by using the Student's t-test (SigmaPlot 2000). All p values less than 0.05 were considered statistically sig nificant. RESULTS AND DISCUSSION Activity-guided column chromatographies of an EtOAc soluble fraction from extracts of M. heterophylla led to the isolation of two compounds. Compound 1 was obtained as an amorphous pale brown powder and reacted positively to the ferric chloride test. The molecular formula was determined to be C 34 H2 8 O22 by FAB-MS, which showed a quasi-molecular ion peak at m/z 789 [M+ + 1-}. The UV spectrum exhibited maxima at 217 and 277 nm. In the 1 H-NMR spectrum, four singlet signals of aryl protons of galloyl groups were detected at B 7 .26-7 .32. A typical anomer H signal was found at 6.10 ppm (lH, d,J:::: 9.3 Hz) and the other sp3 protons of sugar moiety were detected at 4.41-5.45 ppm. In the 13 C-NMR spectrum, the signals of four carbonyl carbon were shown at 167.32 (lC), 167.13 (2C), and 166.94 (lC) ppm, respectively. Twenty-four aromatic carbons of four galloyl groups were detected at 146.27-146.3 7 (SC, C-3 ', 5 '), 139.00-139.29 (4C, C-4'), 121.77-122.18 (4C, C-1 '), and 110.26-110.42 (SC, C-2', 6') ppm. The anomer C signal and five sp3 carbons were detected at 102.93 and 63.08-74.02, respectively. From these data, compound 1 was postulated to be 1,2,4,6- tetra-O-galloyl-�- 0 -glucopyranose (Figure 1). The structure was verified by the reported spectral results (13-16). Compound 2 was obtained as an amorphous white powder and reacted positively to the ferric chloride test. The molecular formula was determined to be C 7 H 6 O 5 by FAB-MS, which showed a quasi-molecular ion peak at m/z 171 [M+ + 1}. The UV spectrum exhibited maxima at 220 and 272 nm. In the 1 H-NMR spectrum, only one peak was detected, at 7 .15 (2S, s, H-2, 6). The signal of carbonyl carbon appeared at 167. 86 ppm, and six aromatic carbons were detected as four peaks at
Purchased for the exclusive use of nofirst nolast (unknown)
From: SCC Media Library & Resource Center (library.scconline.org)