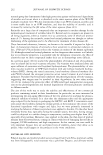
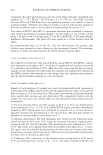
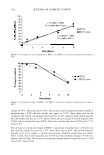
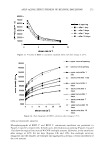
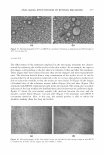
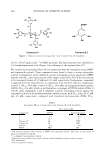
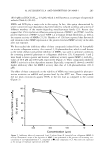
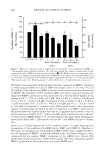
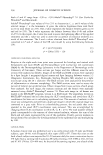
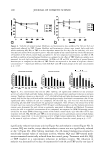
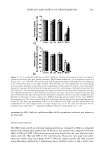
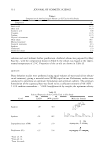
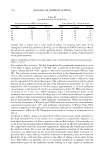
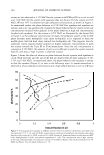
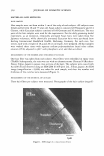
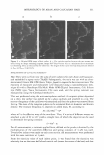
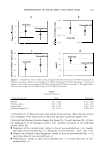
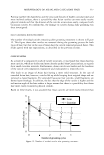
EFFICACY AND SAFETY OF DEOXYARBUTIN 297 three coded test sites was (a) left untreated, (b) treated with 3% dA, or (c) treated with 4% HQ. Treatments were topically applied three times per week for five weeks, at 12.5 µ1/2 cm2 in moisturizer (oil-in-water emulsion type), using an occlusive patch system, modified to a semi-occlusive system when necessary to manage irritation. For skin lightness evaluation, L values were obtained using the Minolta Chroma Meter at the end of tanning (baseline) and termination of study (five weeks), and the percentage of tan retained was quantitated (i.e., L value at end of trial/L value at beginning of treatment x 100) at the end of the trial. Written informed consent compliant with 21 CFR 50.25 was obtained from each subject prior to enrollment in the study. Subjects and graders were blinded to the identity of each product. STATISTICAL ANALYSIS Data from the cell culture and the clinical trial were subjected to statistical analysis using one-way analysis of variance (ANOV A) in conjunction with Student's t-test. One-way ANOV A was used to determine if there were differences among groups, and then multiple comparison procedures (Bonferroni t-test) were used to isolate these differences. Differences were considered significant if P 0.05. Animal results (11.L and da) were analyzed as a one-between (subject) one-within (time) repeated-measurement analysis of variance using the PROC MIXED model in SAS. The Bonferroni correction of the p-value was calculated by dividing the test-wise p-value by the number of comparison groups (p-value for our animal study = 0.004). For epidermis size results, One-way ANOVA and the Bonferroni t-test were used to compare treatment groups with the vehicle control group. Differences were considered significant if p 0.05. RESULTS COMPARATIVE EFFECT OF TYROSINASE INHIBITORS ON THE VIABILITY OF CULTURED HUMAN MELANOCYTES, KERATINOCYTES, AND FIBROBLASTS The effect of each tyrosinase inhibitor (i.e., dA, HQ, KA, AR, and TBP) on the viability of human melanocytes derived from both light (lt) and dark (dk) skin was evaluated in a dose-dependent manner (Tables I and II). The maximum concentration of dA that allowed 95 % viability (Table II) was fourfold higher than that of HQ on both dark and light human melanocytes. In addition, light melanocytes could tolerate a fourfold higher concentration of either dA or HQ than dark melanocytes. In contrast, KA, AR, and TBP all exhibited a maximum concentration of 50 µM for both dark and light melanocytes. The effect of each tyrosinase inhibitor on the viability of human fibroblasts and kera tinocytes was evaluated in a dose-dependent manner (Figures 1 and 2). HQ exhibited a statistically significant inhibition of viability in human fibroblasts and keratinocytes compared to dA at 25 µM, 12.5 µM, and 6.25µM (Figure 1). At the maximum con centration tested (i.e., 25 µM), loss of viability in keratinocytes due to HQ was associated with cell fragmentation and detachment. This indication of apoptosis was not apparent in keratinocytes treated with dA at the same concentration at which the viability of keratinocytes was compromised (Figure lc-e). AR and KA demonstrated less effect on

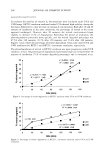
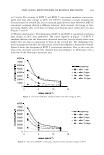
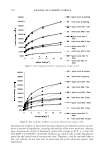
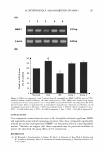
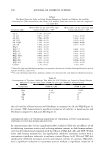
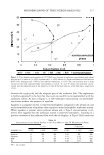
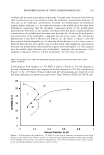
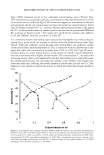
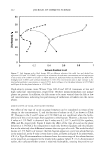
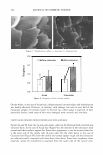
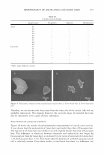
298 JOURNAL OF COSMETIC SCIENCE Table I The Mean Values for Light and Dark Human Melanocyte Viability at Different dA and HQ Concentrations [The concentration that allows 95% viability (bold) was chosen for each test compound (see Table II)} Treatment (µM) dA 25 dA 12.S dA 6.25 dA 3.125 dA 1.5625 dA 0.78 HQ25 HQ 12.S HQ 6.25 HQ 3.125 HQ 1.5625 HQ 0.78 HQ 0.391 HQ 0.195 Control Mean viable cell per control for light human melanocytes ± SD* 0.795 ± 0.012** 0.877 ± 0.063 0.963 ± 0.018 0.986 ± 0.011 1.002 ± 0.024 0.990 ± 0.021 0.851 ± 0.023 0.854 ± 0.025 0.909 ± 0.010 0.899 ± 0.035 0.953 ± 0.047 0.969 ± 0.019 0.975 ± 0.043 0.983 ± 0.036 1.01 ± 0.02 Mean viable cell per control for dark human melanocytes ± SD* 0.761 ± 0.076 0.854 ± 0.045 0.912 ± 0.031 0.949 ± 0.049 0.971 ± 0.027 0.814 ± 0.019 0.859 ± 0.035 0.910 ± 0.032 0.929 ± 0.006 0.932 ± 0.023 0.958 ± 0.034 0.979 ± 0.024 1.00 ± 0.00 * Values for light and dark human melanocytes represent the mean of cell lines developed from four and six separate foreskins, respectively. ** In each individual experiment, duplicate samples were measured for each duplicate flask/concentration. Table II Concentrations of Tyrosinase Inhibitors That Allow for 95% Viability per Control in Normal Human Melanocytes Derived from Dark (NHM-dk) and Light (NHM-lt) Skinned Persons Compounds NHM-dk (µM) NHM-lt (µM) HQ 0.391 1.5625 dA 1.5625 6.25 TBP so so KA so so AR so so the cell viability of keratinocytes and fibroblasts as compared to dA and HQ (Figure 2). In contrast, TBP demonstrated a significant reduction of viability in keratinocytes and fibroblasts compared to KA and AR (Figure 2). COMPARATIVE EFFECT OF TYROSINASE INHIBITORS ON TYROSINASE ACTIVITY AND MELANIN SYNTHESIS OF CULTURED HUMAN MELANOCYTES At concentrations that did not significantly effect viability (Table II), the efficacy of dA in inhibiting tyrosinase activity and reducing melanin content in dark human melano cytes was determined and compared with the efficacy of HQ, KA, AR, and TBP. Within intact dark human melanocytes, dA significantly inhibited tyrosinase activity with a concomitant significant reduction in melanin content (Figure 3a,b). KA and TBP also significantly inhibited tyrosinase activity and melanin content. In contrast, HQ exhib ited a significant reduction in tyrosinase activity without a significant reduction in
Purchased for the exclusive use of nofirst nolast (unknown)
From: SCC Media Library & Resource Center (library.scconline.org)