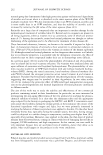
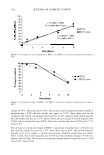
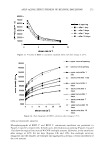
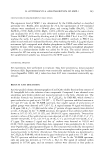
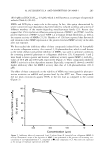
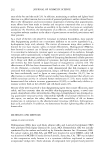
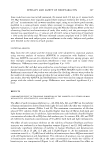
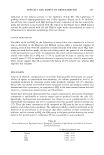
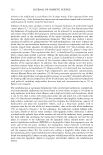
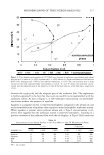
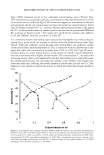
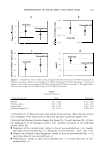
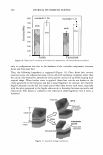
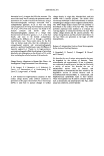
MICROEMULSIONS OF TRIGLYCERIDE-BASED OILS 321 Type I-III-II trans1t10n occurs at low surfactant concentrations, and a Winsor Type I-IV-I transition occurs at high surfactant concentrations when the sebum fraction in the oil increases and (iii) a Winsor Type I-IV-II transition appears at intermediate surfactant concentrations. As the salt concentration increases, the surfactant concentration at which Type IV forms, as denoted by "C," increases, whereas the fraction of sebum in the mixed oil ("F") at this point decreases. A similar trend is also seen for the system with IPM and EL, as shown in Figures 6 and 7. The values of C and F for the systems with different co-oil and different salinities are shown in Table IV. It is commonly known that adding salt increases the hydrophobicity of the surfactant system for a given co-oil, an increase in salinity shifts the phase behavior from Type I-III-II. When the surfactant system becomes more hydrophobic, the surfactant system can microemulsify a more hydrophobic oil. This is consistent with the observation in this paper that when salt concentration increases from 0.5% to 3.0%, the Type III micro emulsion forms at a lower sebum fraction in the mixed oil, which is more hydrophobic than the oil mixture with a higher sebum fraction. The concentration, C, increases with increasing salinity. This can be explained by the fact that adding salt in general decreases the solubilization because the salt molecules adsorb at the interface and displace the surfactant molecules, reducing the overall number of interactions per unit area (1). This behavior is also similar to that of the system in which low-molecular-weight alcohol is used. 60 50 ' ' '#. 40 � C: ca 30 rs/ 20 10 0 0 ::( � ' ' ""' ,;a' / l. \ J 0.2 _,;-'J , -- --er- , -- - 0.4 0.6 0.8 1 Sebum fraction in oil Figure 6. Fish diagram with isopropyl myristate (1PM) at different salinities (the solid line and dashed line represent 0.5% and 1.5% NaCl, respectively) as a function of surfactant concentration and sebum fraction in oil (a value of O is 100% co-oil and 1 is 100% sebum oil). Surfactant/linkers studied here are AOT (4%), hexylglucoside (5.06%), and sorbitan monooleate (5.13%). The concentration ratio is kept constant as the total surfactant/linker concentration is varied (25°C). Refer to Figure 3 for the phase behavior at 0.5% NaCl and Figure 4 for the phase behavior at 1.5% NaCl.

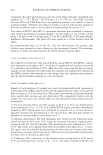
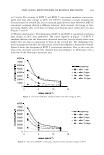
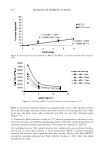
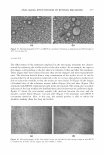
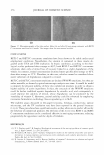
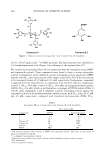
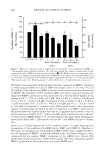
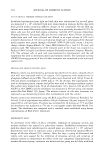
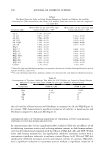
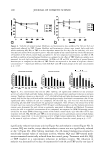
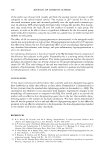
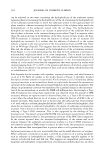
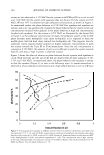
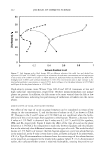
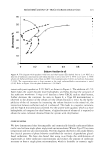
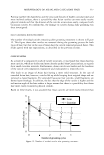
322 JOURNAL OF COSMETIC SCIENCE 60 --------------------------------, 50 -- -- tl -- -- -- 40 / Cl � C \ Jg 30 .... (,) -- ' � ' ::I !!!. 20 I I ♦ 10 0 0 0.2 0.4 0.6 0.8 1 Sebum fraction in oil Figure 7. Fish diagram with elthyl laurate (EL) at different salinities (the solid line and dashed line represent 0.5% and 1.5% NaCl, respectively) as a function of surfactant concentration and sebum fraction in oil (a value of O is 100% co-oil and 1 is 100% sebum oil). Surfactant/linkers studied here are AOT (4%), hexylglucoside (5.06%), and sorbitan monooleate (5.13%). The concentration ratio is kept constant as the total surfactant/linker concentration is varied (25°C). Refer to Figure 3 for the phase behavior at 0.5% NaCl and Figure 4 for the phase behavior at 1.5% NaCl. High-salinity systems create Winsor Type I-III-II and I-IV-II trans1t1ons at low and high surfactant concentrations, respectively. Neither nonmicroemulsion nor sponge phases are present. In addition, the fish seems to be more vertical than the fish at low salt concentrations, indicating less partitioning of surfactants or linkers into the excess phases. EFFECT OF TYPE OF CO-OIL ON THE FISH DIAGRAM The effect of the type of co-oil on phase behavior can be considered in terms of the change in the concentration, C, and the fraction of sebum in oil, F, as shown in Table IV. Changes in the C and F values at 0.5% NaCl are not significant when the hydro philicity of the co-oil increases from squalene to ethyl laurate. However, a decrease in the F value at 1.5% NaCl is observed: the F values are 0.2, 0.175, and 0.02 for squalane, IPM, and EL, respectively. Figure 8 shows the effect of the type of co-oil on the phase behavior at 1.5% NaCl the comparison is made only between squalane and ethyl laurate due to the relatively clear difference between the two types of co-oils. The result for ethyl laurate at 1.5% NaCl is of interest: the fish diagram appears at a very low sebum fraction in the mixed oil, or the F value is very close to zero, as shown in Figure 8. In other words, if F = 0, a Type II microemulsion is observed over the entire range of the sebum fraction in the mixed oil, as compared to the results with squalane (where F = 0.2). As mentioned earlier, this surfactant/linker system is relatively hydrophilic, creating the positive cur-
Purchased for the exclusive use of nofirst nolast (unknown)
From: SCC Media Library & Resource Center (library.scconline.org)