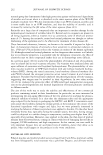
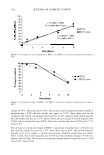
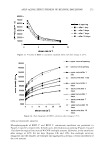
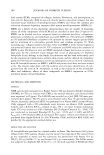
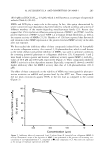
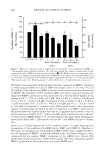
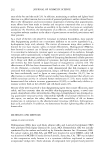
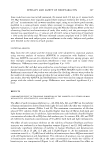
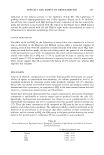
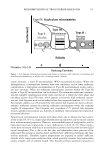
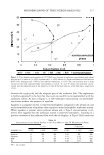
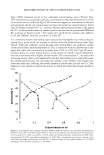
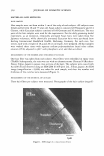
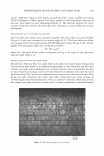
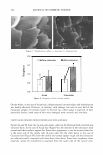
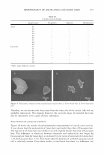
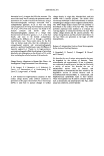
EFFICACY AND SAFETY OF DEOXY ARBUTIN :g 12 �8 ��OB o m·i o.s �2 en a. 0.4 0 0) �.2_ 02 a Q. 0 :g 12 C 0 - 0 1 C ,_ � � 08 oa5 .£ 0 06 � a. (I) O 0.4 �E � 02 Q. 0 b Control dA 1.56 HQ 0.39 TBP 50 Control dA l .56 HQ 0.39 TBP 50 301 Figure 4. dA is a reversible inhibitor in which significant recovery of tyrosinase activity and melanin content occurred five days after halting treatment. Dark human melanocytes, in six triplicate groups at a density of 1 x 10 5 cells/well, were treated daily with fresh growth media containing each test compound at the concentration that did not affect viability. After five days, one treated group and one control group were assessed for inhibition of tyrosinase activity and melanin content reduction. At day 5, one of the treated groups had treatment halted and was fed, along with one of the control groups, fresh media for another five days. On day 11, the four remaining groups (test compound treated for ten days, vehicle treated for ten days, test compound treated for five days and then untreated for five days, and vehicle treated for five days and then untreated for five days) were assessed for tyrosinase and melanin content as described in Materials and Methods. (a) Tyrosinase activity, expressed as DPM/24 hours/µg protein divided by the mean DPM/24 hours/µg protein of the vehicle-control flask, and (b) melanin content, expressed as µg melanin/mg protein divided by the mean µg melanin/mg protein of the vehicle-control flasks, for cells treated with test compound for five days (stippled bars), ten days (striped bars), or for five days and untreated for five subsequent days (solid bars). * = Significant difference from the control group at p 0.05. treatment for HQ. Only the inhibitory effect of dA on melanin synthesis was shown to be reversible. ANIMAL STUDY RESULTS The effectiveness of dA on reducing hyperpigmentation compared to HQ in a xenograft model with human skin grafted onto SCID mice was assessed and compared with the effect of HQ and TBP. Three mice per group were treated five days per week for eight weeks with dA, HQ, and TBP at 5% concentration. Photos for each graft were taken every two weeks using the Charm View™ (Moritex, Japan) system and then assessed using Photoshop software for L (lightening) and a (redness) values. L and a values were

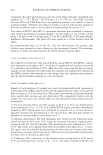
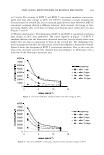
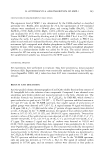
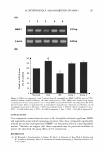
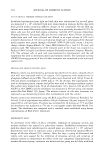
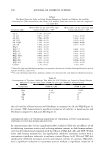
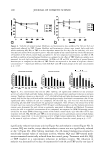
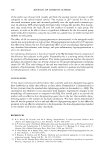
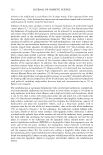
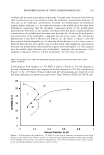
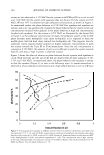
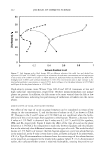
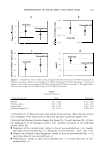
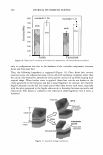
302 JOURNAL OF COSMETIC SCIENCE then converted to the L* and a* values of the CIE color model, using equations (1) and (2) presented in the Materials and Methods section. Topical treatments for eight weeks with dA (Figure Sa) resulted in a gradual improve ment in skin lightening compared to the vehicle-treated control (i.e., increase in 11.L* values higher values for dL* indicate the occurrence of lightening). HQ and TBP treatment also resulted in a gradual increase in skin lightening. Statistical analysis demonstrated that skin lightening at weeks 4, 6, and 8 in all treated groups was statistically different from the initial L value in each group (p 0.0001). The data in Figure Sa is also presented in a bar graph (Figure Sb) that includes the standard deviation (standard error, SE) per group. Standard deviation was relatively greater in the HQ- and TBP-treated groups at weeks 4, 6, and 8 than in the respective dA-treated groups. Histological sections of xenografts were obtained at the termination of treatment (i.e., week 8) and evaluated for percent melanin per epidermal area as described in Material and Methods. Treatment with all tyrosinase inhibitors resulted in a significant 12 ------------------- - 10 � 8 ai C: c f 6 ai � 4 a O 0 - Conlrol · V · cl,f\ ------- HO - --- 18P 2wb * 4wb 8wb 8wb 16 �------------------ 14 l 12 ai 10 C S 8 � ai ::::i 8 _J j 4 a 2 c::::J Con1rol IIIIIIl dA l!ail!llBIHO -TBP 2wk• 4wks 6wk• 8wb Figure 5. Topical treatment for eight weeks with dA resulted in a gradual increase in skin lightening compared to the vehicle-treated group. Human skin grafted onto mice (three mice per group) was treated with 5% test compounds, five days per week, for eight weeks. Treatment sites were assessed biweekly for the degree of pigmentation using the Charm View™ system. The Land a values for each treatment site were obtained by using Adobe Photoshop software and then were converted to the L* and a* values of the CIE color mode. The time course of change in L* values from baseline value for grafts treated with dA, HQ, TBP, and vehicle are presented as (a) a line graph and (b) a bar graph depicting the mean ± SE. * = Significant difference atp 0.0001 between the baseline value for each group and their values at four-, six-, and eight-week points.
Purchased for the exclusive use of nofirst nolast (unknown)
From: SCC Media Library & Resource Center (library.scconline.org)