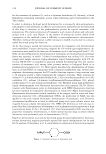
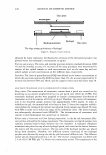
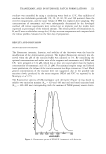
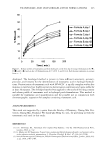
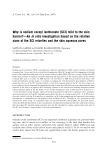
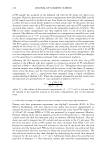
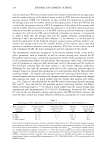
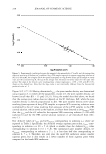
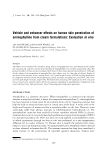
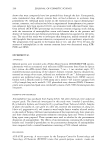
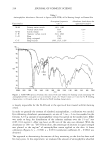
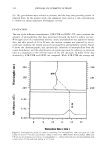
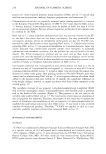
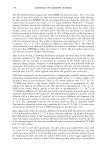
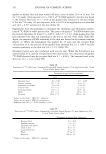
TRANEXAMIC ACID IN HYDROGEL PATCH FORMULATIONS 221 medium was controlled by using a circulating water bath at 32°C. One milliliter of medium was withdrawn periodically (10, 20, 30, 60, 90, and 180 minutes) from the receiver compartment, and the same volume of PBS was replaced after sampling. The concentrations of tranexamic acid were subsequently determined by the developed method. All release experiments were carried out in triplicate and the results were expressed as percentages of the released amount. The release profiles of formulations A, B, and C were studied after storage for 120 days at room temperature and compared with the release profiles evaluated on the first day of preparation. RESULTS AND DISCUSSION DERIVATIZATION PROCEDURE The fluorescent intensity, linearity, and stability of the derivative were the keys for modification of the derivatization protocol. The highest fluorescent intensity was ob served when the pH of the reaction buffer was adjusted to 9.5. By considering the optimal concentrations and molar ratio of the reagents and tranexamic acid, NDA and CN- were prepared at 134 µM, which was at least ten times higher than the highest concentration of tranexamic acid (13.25 µM). For minimal reagent usage and limited waste production, the volume of the reaction mixture was kept constant at 2.0 ml. Much greater concentrations of the reactant were not suggested, due to the possible side reactions slowly produced by the excess reagents (NDA and CN-) as reported by de Montigny et al. (27). The fluorescence spectra of CBI-tranexamic acid derivative (Figure 4) was found to exhibit two excitation maxima (A. ex = 420 and 440 nm) and one broad emission band O'- em = 460-480 nm) corresponding with the maxima of NDA/primary amine deriva- 3 oo 350 400 450 scfo nm wavelength Figure 4. Fluorescence spectra of NDA/CN-/tranexamic acid derivative.

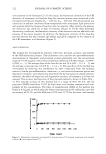
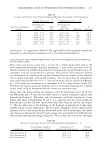
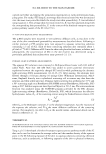
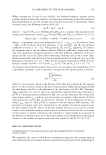
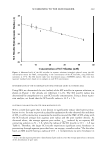
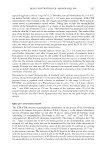
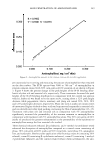
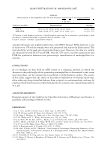
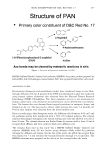
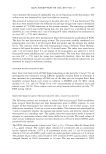
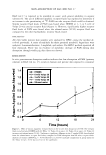
222 JOURNAL OF COSMETIC SCIENCE rives reported in the literature (27). In this study, the fluorescent intensities of the CBI derivative of tranexamic acid and the drug-free reaction mixture were monitored at the excitation and emission maxima ("- ex = 420 nm, "- em = 480 nm). The derivatization was carried out in ambient conditions (room temperature with unnecessary light protection) and required only five minutes of reaction time to complete. After reaching the plateau, the derivative was stable for at least 30 minutes (Figure 5). Under these developed derivatizing conditions, the fluorescent intensity of the derivative was not affected by the presence of the excess reagents. In addition, the fluorescent intensity of the drug-free reaction mixture was also constant and almost negligible compared to the intensity of the CBI-tranexamic acid derivative (Figure 5). ASSAY VALIDATION The method was investigated for linearity, selectivity, precision, accuracy, and stability of the CBI-derivatized product. The calibration curve used for the spectrofluorimetric determination of tranexamic acid possessed a linear relationship over the concentration range of 8.4-84.0 µg/ml, with a mean correlation coefficient of 0.9992 (range = 0.9989- 0.9995, n = 5). The average slope of the best-fit line was 28.0 (S.D. = 0.2, n = 5), and the average y-intercept was 163.4 (S.D. = 1.3, n = 5). The specificity of the method was investigated by observing any interference by other compounds from the hydrogel matrices. Similar spectrofluorimetric characters, i.e., excitation and emission spectra and fluorescent intensity, were observed as those from the derivatization of a blank solution. However, the effects of impurities and degradation products of tranexamic acid were not assessed. The accuracy and precision of the proposed method is shown in Table II (n = 5). The interday accuracy of this method was in a range of 98.0-101.8%, and the precision (%RSD) was below 1.85% for both intra- and interday evaluation and inde pendent of the concentration. The limit of quantification (LOQ) of the method was found at 8.4 µg/ml, at which point the lowest concentration on the calibration curve had an accuracy of 99.3%, and the RSD was 0.92% and 1.17% for the intra- and interday �2000 •ri Ill l:J QI � 1500 ,I.J A � 1000 Ill QI ... 0 ,:l 500 QI I •ri ,I.J RI r-1 QI 0 300 600 900 1200 1500 1800 2100 Time (sec) Figure 5. Fluorescence intensities investigated by derivatization of 50.4 µg/ml tranexamic acid standard solution ( ♦) and reagent blank (0).
Purchased for the exclusive use of nofirst nolast (unknown)
From: SCC Media Library & Resource Center (library.scconline.org)