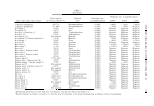
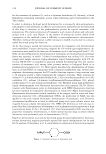
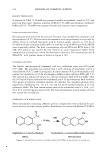
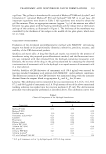
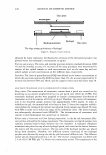
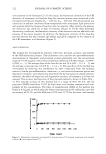
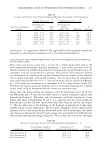
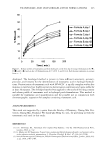
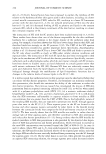
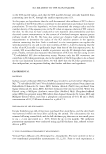
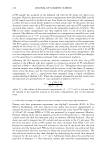
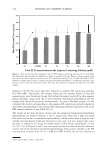
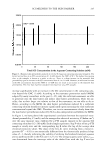
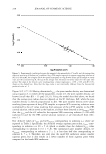
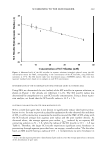
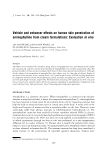
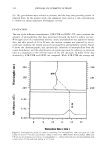
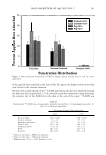
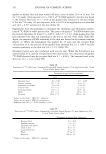
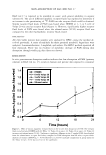
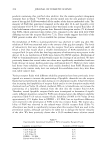
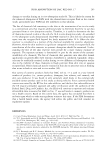
TRANEXAMIC ACID IN HYDROGEL PATCH FORMULATIONS 223 Table II Accuracy and Precision of the Proposed Analytical Method for Tranexamic Acid Determination Intraday precision (n = 5) Interday precision (n = 5) Estimated cone. Estimated cone. Nominal concentration (µg/ml) RSD (µg/ml) % (µg/ml) (mean ± SD) (%) (mean ± SD) RSD (%) Recovery 8.4 8.49 ± 0.13 0.92 8.34 ± 0.17 1.17 99.3 16.8 16.19 ± 0.13 0.57 16.81 ± 0.42 1.84 100.0 33.6 34.08 ± 0.47 1.18 32.92 ± 0.72 1.85 98.0 50.4 51.52 ± 0.08 0.14 51.31±0.41 0.71 101.8 67.2 66.67 ± 0.22 0.30 67.62 ± 1.19 1.62 100.6 84.0 83.73 ± 0.13 0.14 83.39 ± 0.37 0.41 99.3 precision (n = 5), respectively (Table II). The applicability of the proposed method was examined by analyzing the tranexamic acid in the hydrogel formulations. APPLICATION OF THE DEVELOPED METHOD FOR ANALYSIS OF TRANEXAMIC ACID IN HYDROGEL PATCH FORMULATIONS Drug content and recovery of drug from a gel base. In a simple dosage form such as the above-mentioned hydrophilic hydrogel preparation, a part of the gel patch could be directly dissolved in a buffer solution prior to derivatization. In all formulations, 4.2% tranexamic acid was incorporated in a gel base. The recovery of the analytical method was determined by comparing the response obtained from the sample to that obtained from a spiked tranexamic acid standard solution. The recoveries from all formulations were in the range of 98.6-99 .1 % (n = 5 for each formula), with no statistical difference (p 0.05) from the concentration of tranexamic acid in a neat solution (Table III). Therefore, the concentrations of tranexamic acid in the hydrogel formulations prepared in this study could be determined directly without an extraction step. Release study. The release profiles of tranexamic acid from formulations A, B, and C into ;,- 1 the PBS buffer, pH 7.4, were the first order kinetics as shown in Higuchi's plot of each formulation (Figure 6). The release rate of tranexamic acid from formulation A was higher than those of formulations B and C. It is apparent that the release profiles of formulation A on day 120 were significantly lower than those on the first day (Figure 7). This was likely due to the shrinkage of the hydrogel in formulation A after three months storage at room temperature. The dry gel was thought to be the tightly packed polymer, and so it had a high density of network chains (29). Contrastingly, the release rate changes in formulations B and C upon storage were not significantly different from those of the newly prepared samples (Figure 6). This is likely due to the lesser shrinkage Table III Recovery of Tranexamic Acid Content in Hydrogel Patch Preparations (n = 5) Concentration equivalent Tranexamic acid Average Formulation to added amount (µg/ml) concentration found (µg/ml) recovery (%) Patch formulation A 84.0 83.0 ± 0.4 98.8 Patch formulation B 84.0 82.8 ± 1.0 98.6 Patch formulation C 84.0 83.3 ± 0.6 99.1

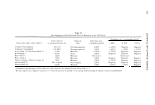
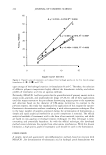
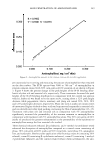
224 Q) en a:s Q) 0::: 2 Cl � 0 60 50 40 30 20 10 0 JOURNAL OF COSMETIC SCIENCE A, y = 4.2032x - 3.6708, R2 = 0.9836 B, y = 2.492x - 0.3232, R2 = 0.9352 0 5 10 15 Square root of time (hr) Figure 6. Higuchi's plot of tranexamic acid released from hydrogel patches on the first day of storage: formulations A ( ♦ ), B (■), and C (6). upon storage of the hydrogel matrices in formulation B and C. Therefore, the selection of different polymer compositions highly affected the formulation stability and release profiles of tranexamic acid into an aqueous medium. Previously, NDA/CN- had been proven for the quantification of primary amines such as amino acids, peptides, and small-molecule drugs (27 ,30,31). All of these applications used this reagent system as the pre-column derivatizing reagent prior to the separation and detection based on the character of CBI-amine derivatives. In contrast to the previous reports, this study has emphasized the application of this reagent for spectro fluorimetric determination without combining it with other separation techniques. Due to the large number of samples generated during the optimization of formulations, a simple and rapid analytical method for an active component is essential. The official analytical methods of tranexamic acid in the form of raw material, injection, and tablet are based on non-aqueous or residual titration techniques (3 ). This technique is time consuming and potentially hazardous. As with the official technique, this developed method cannot eliminate the signals from other amine interferences. With this known limitation, a high purity grade of tranexamic acid should be used in the formulation. CONCLUSION A simple, rapid and quantitative spectrofluorimetric method, based on reaction with NDA/CN-, for determination of tranexamic acid in hydrogel patch formulations was
Purchased for the exclusive use of nofirst nolast (unknown)
From: SCC Media Library & Resource Center (library.scconline.org)