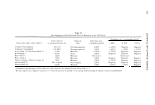
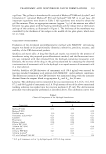
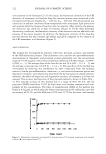
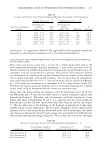
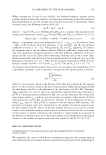
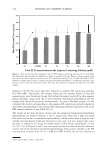
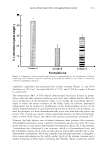
262 JOURNAL OF COSMETIC SCIENCE applied to human skin and then washed off after a total of either 24 h or 15 min. For the 72-h study (24-h exposure), 0.2 ± 0.01 % of 14 C-PAN applied to the skin was found in the receptor fluid and 15.3 ± 2.6% of the applied dose remained in the skin (Table I). For the 72-h study (15-min exposure), 0.08 ± 0.02% of the applied dose was absorbed and 14.0 ± 4.5% remained in the skin (Table II). Experiments were also performed to determine the absorption and subsequent metabo lism of 14 C-PAN in viable porcine skin. The percent of applied 14 C-PAN absorbed into the receptor fluid after 24 h was 0.3 ± 0.05%, with 12.7 ± 1.2% of the applied dose that had penetrated the skin still remaining in the skin at the end of the study (Table III). Again, the majority of PAN remaining in the skin was located in the stratum corneum (Figure 2). When the formulation was applied for 15 min, and the receptor fluid collected for 24 h, the percent of the applied dose absorbed was O .1 ± 0.01 % and the amount remaining in the skin was 8.9 ± 1.3% (Table IV). Extended studies were also conducted with porcine skin. When the formulation was removed after 24 h, and the receptor fluid was collected for 7 2 h, the percent of applied 14 C-PAN absorbed into the receptor fluid was 0.7 ± 0.06%. The amount found in the skin was 12.2 ± 2.2% (Table III). Table III Penetration of 14 C-PAN from a Commercially Available Suntan Product (24-h Application) after 24 and 72 h in Viable Porcine Skin Receptor fluid Stratum corneum Epidermis and dermis Total in skin Total penetration Wash Recovery 1 Values are the mean ± SEM of 17 replicates. 2 Values are the mean ± SEM of four replicates. Percentage of applied dose penetrated 24 h 1 0.3 ± 0.0S 10.7 ± 1.9 2.0 ± 0.4 12.7 ± 1.2 13.0 ± 2.2 93.1 ± 5.2 106.1 ± s.s 0.7 ± 0.06* 8.4 ± 1.3 3.8 ± 0.9 12.2 ± 2.2 12.9 ± 2.2 96.9 ± 7.8 109.8 ± 9.4 * Different from 24 h, p 0.001 (Student's t-test). Table IV Penetration of 14 C-PAN from a Commercially Available Suntan Product (1S-min Application) after 24 h in Viable Porcine Skin t Receptor fluid Stratum corneum Epidermis and dermis Total in skin Total penetration Wash Recovery 1 Values are the mean ± SEM of 11 replicates. Percentage of applied dose penetrated 0.1 ± 0.01 7.6 ± 1.2 1.3 ± 0.2 8.9 ± 1.3 9.0 ± 1.3 97.9 ± 3.1 106.9 ± 3.1

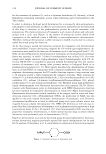
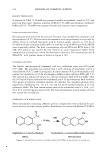
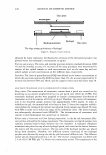
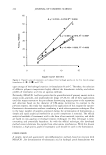
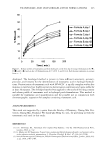
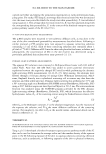
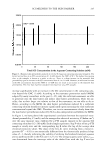
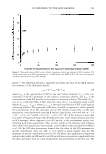
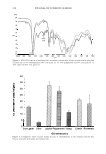
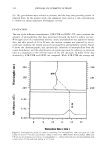
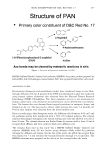
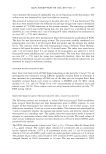
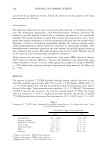
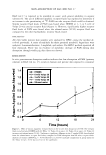
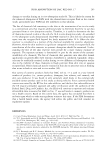
SKIN ABSORPTION OF D&C RED NO. 17 263 D&C red 17 is reported to be insoluble in water, with greater solubility in organic solvents (6). The use of different lipophilic receptor fluids was explored to determine if an increase in the partitioning of 14 C-PAN into the receptor fluid could be obtained. Similar receptor fluid levels of PAN were found when HHBSS or 1, 3, or 6 wt% of Volpo 20 was used as receptor fluid (Figure 3). However, significantly higher receptor fluid levels of PAN were found when the ethanol-water (50:50) receptor fluid was compared to the other hydrophobic receptor fluids tested. HPLC RESULTS All 24-h viable porcine skin samples were analyzed by HPLC, using the method de scribed previously. A series of standards for three potential metabolic byproducts were analyzed: 4-aminoazobenzene, 2-naphthol, and aniline. The HPLC method separated all four chemicals. There was no evidence of metabolic cleavage of PAN during skin absorption through viable pig skin (data not shown). DISCUSSION In vitro percutaneous absorption studies indicate that low absorption of PAN (primary colorant in D&C red no. 1 7) occurs in human and porcine skin exposed to consumer "'C 1.4 a, .c 0 1.2 .c -+- HHBSS --o- 6 wt% Volpo 20 ---,- 3 wt% Volpo 20 ---:]- 1 wt% Volpo 20 C 1.0 a, --- Ethanol-water * 0 0.8 C "'C .!!! 0.6 - a. a. C 0.4 * a, 0.2 a, a. 0.0 0 6 12 18 24 Time (hours) Figure 3. Effect of various lipophilic receptor fluids on the in vitro skin absorption of PAN. The receptor fluids tested included HHBSS with 4% BSA, 1 % Volpa 20 in water, 3% Volpa 20 in water, 6% Volpa 20 in water, and ethanol-water (50:50). *Indicates a significant difference in the% applied PAN dose absorbed from the ethanol-water receptor fluid when compared to PAN absorption from all other receptor fluids. Analysis of variance (ANOVA, p 0.05) followed by a posteriori multiple comparisons of group means by the Tukey test (p 0.05) was used to test for significance.
Purchased for the exclusive use of nofirst nolast (unknown)
From: SCC Media Library & Resource Center (library.scconline.org)