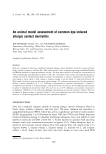
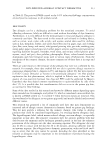
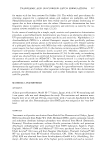
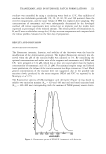
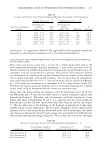
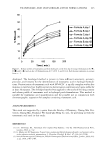
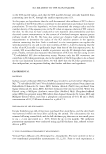
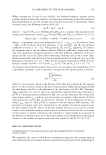
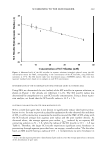
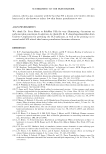
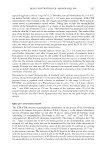
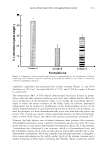
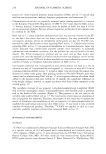
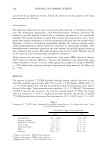
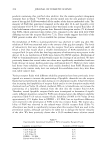
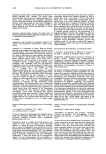
236 JOURNAL OF COSMETIC SCIENCE 35.0 ----------------------------------- 30.0 ,_, ,._. 25.0 C � a. U 20.0 ·c � 15.0 � C :,i! 10.0 r.rJ 5.0 0.0 I I I I I 0.2 I I I I I I I I I I 1.0(CMC) 8.7 35 50 100 200 Total SCI Concentration in the Aqueous Contacting Solution (mM) Figure 1. Skin electrical currents induced in vitro by SCI aqueous contacting solutions (0.2 to 200 mM). The dashed line passing above the filled bars is drawn as a guide to the eye. There is a sharp increase in the skin electrical current upon an increase in the SCI concentration from 0.2 to 1.0 mM (the CMC of SCI). However, an additional increase in the SCI concentration beyond the CMC of 1.0 mM does not result in an increase in the in vitro skin electrical current. The error bars represent standard errors based on six p-FTS samples. changes in the SC that occur upon skin exposure to aqueous SCI contacting solutions (0.2-200 mM). 1 Specifically, the average radius and the number density of the skin aqueous pores were determined using the hindered-transport model of the skin aqueous porous pathways, along with the in vitro mannitol transdermal permeability and the average skin electrical resistivity measurements. To gain additional insight, we also compared the results corresponding to the aqueous SCI contacting solution (solution a) with those corresponding to the aqueous SDS contacting solution (solution b) and to the PBS control (solution c) [see Table I} (13 ). The results of the skin electrical current and the mannitol transdermal permeability measurements are shown in Figures 1 and 2, respectively. Note that a large (or small) skin electrical current or transdermal permeability, which results from a high (or low) transfer rate of permeant molecules (mannitol in our case) or of ions, respectively, across the skin, is indicative of a large (or small) extent of skin barrier perturbation in vitro (3,13,27-33). In Figures 1 and 2, one can clearly see that the values of the skin electrical current and of the mannitol transdermal permeability both increase sharply as the SCI concentration increases from 0.2 to 1 mM (the CMC of SCI), but do not continue to 1 Note that for SCI, 1 mM = 0.03 wt%.

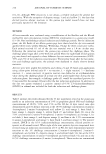
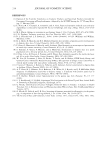
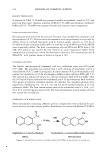
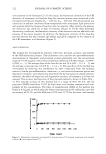
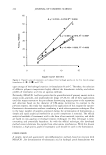
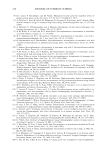
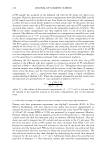
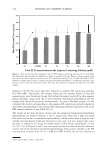
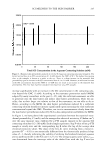
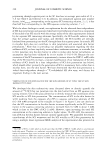
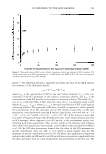
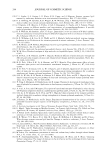
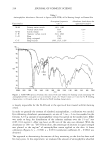
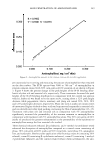
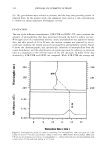
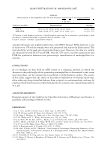
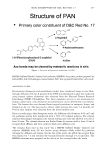
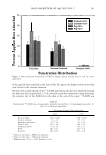
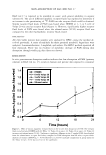
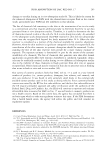
SCI MILDNESS TO THE SKIN BARRIER 237 2.5E-04 .-------------------------------------. E 2.0E-04 Col ._., f 1.5E-04 dJ � ·a= 1.0E-04 � 5.0E-05 CMC = 1.0mM 0.0E+00 ..,. _____ __,_ _____ __. ______ ..._ _____ ..._ _____ ...._ __ _. 0 40 80 120 160 200 Total SCI Concentration in the Aqueous Contacting Solution (mM) Figure 2. Mannitol skin permeability induced in vitro by SCI aqueous contacting solutions (triangles). The dotted vertical line at an SCI concentration of 1.0 mM denotes the CMC of SCI. The dashed line passing close to the triangles is drawn as a guide to the eye. There is a sharp increase in the mannitol skin permeability upon an increase in the SCI concentration from 0.2 to 1.0 mM. However, an additional increase in the SCI concentration beyond the CMC of 1.0 mM does not result in an increase in the mannitol skin permeability. The error bars represent standard errors based on six p-FTS samples. increase significantly with an increase in the SCI concentration in the contacting solu tion beyond the CMC (1 mM). According to the monomer penetration model (MPM) adopted by many researchers in the past (1-15), only the surfactant monomers are able to penetrate into the skin barrier and induce skin barrier perturbation, while the mi celles, due to their larger size relative to that of the monomers, are not able to do so. Hence, according to the MPM, the skin barrier perturbation induced by a surfactant contacting solution should not increase significantly upon increasing the total surfactant concentration beyond the CMC. Therefore, our in vitro measurements clearly show that the skin barrier perturbation induced by SCI is dose-independent and follows the MPM. In Figure 3, we have plotted the experimental correlation between the mannitol trans dermal permeability, P (cm/h), and the average skin electrical resistivity, R (kohm-cm2), over the same exposure time, exhibited by p-FTS samples exposed to the aqueous SCI contacting solutions (0.2-200 mM). Each triangle represents a log P value of one p-FTS sample at steady state and the corresponding log R value (the log of the average skin electrical resistivity value). The slope of the best-fit curve resulting from a linear re gression (R 2 = 0.91) is not statistically different from the theoretically predicted slope value of -1, thereby indicating the validity of utilizing the hindered-transport aqueous porous pathway model in the SCI case (13,27 ,31). The average aqueous pore radius, r p ore ' was determined from the intercept value of the dashed line with the log P axis (see
Purchased for the exclusive use of nofirst nolast (unknown)
From: SCC Media Library & Resource Center (library.scconline.org)