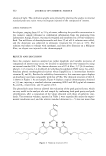
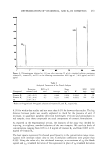
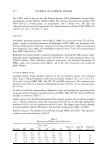
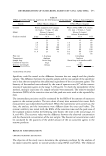
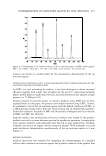
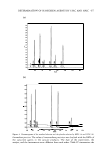
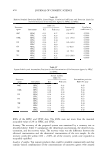
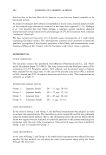
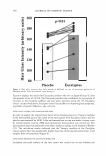
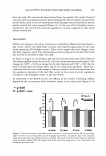
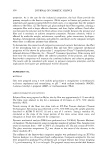
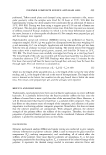
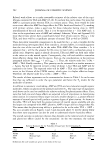
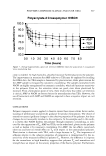
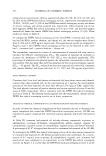
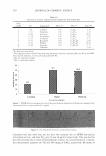
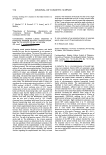
DETERMINATION OF SUNSCREEN AGENTS BY UPLC AND HPLC 477 (a) •,34 •,J2' ,JO- •.2e- •,2& •.24 •,22: •,2D- •.1&: •.1&- •.14 •-12: •.1D- •.�&: •.�&: a; .. � r-- ! ·-�' O! V ... � � , .. ro •.:I� � � 8 0 '·- . � - - - - L I I z.co 6.00 (b) ! • 5 D.111 1.IID 2.0D 3.111 4.111 - qo � ... � - - I 8.00 lllni.15 !i ,d j! 5.811 MnlN §! oi - Ii.Ill - I I ,o.oo 1:HO I ... � 7.111 UD 9.0D 10.0D Figure 4. Chromatograms of the standard solution and the placebo solution by HPLC (a) and UPLC (b). Intermediate precision. The value of intermediate precision was checked with the RSDs of the sunscreen agents in the suncare products. The date of the experiment, the analyst, and the instruments were different from each other. Table IV summarizes the

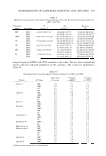
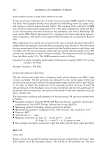
478 JOURNAL OF COSMETIC SCIENCE Table III Relative Standard Deviations (RSDs), Linear Ranges, Correlation Coefficients, and Detection Limits for the Determination of Six Sunscreen Agents by HPLC and UPLC Sunscreen RSD (%) Linear range Correlation agent Instrument RT Peak area (µg ml- 1 ) coefficients (r2) IMC HPLC 0.31 0.27 6.6-105.0 0.9999 UPLC 0.36 0.35 0.9999 OMC HPLC 0.08 0.39 12.2-195.0 0.9999 UPLC 0.11 0.44 0.9999 OS HPLC 0.16 0.27 8.9-142.0 0.9999 UPLC 0.31 0.18 0.9999 OT HPLC 0.35 0.10 5.1-82.0 0.9999 UPLC 0.06 0.16 0.9999 TM HPLC 0.18 0.22 4.9-79.0 0.9998 UPLC 0.33 0.34 0.9999 TS HPLC 0.51 0.21 10.3-164.0 0.9999 UPLC 0.29 0.39 0.9999 Table IV System Stability and Intermediate Precision for the Determination of Six Sunscreen Agents by HPLC and UPLC System stability RSD (%) Sunscreen Intermediate precision agent Instrument RT Peak area RSD (%) assay IMC HPLC 0.33 0.45 0.49 UPLC 0.15 0.23 0.52 OMC HPLC 0.14 0.55 0.44 UPLC 0.29 0.49 0.43 OS HPLC 0.14 0.36 0.59 UPLC 0.11 0.28 0.63 OT HPLC 0.20 0.60 0.92 UPLC 0.15 0.54 0.56 TM HPLC 0.10 0.36 0.44 UPLC 0.16 0.33 0.23 TS HPLC 0.12 0.40 0.52 UPLC 0.15 0.38 0.49 RSDs of the HPLC and UPLC data. The RSDs were not more than the maximal acceptable value of 2% in HPLC and UPLC. Accuracy. The accuracy of the proposed system was examined by a recovery test as described above. Table V summarizes the theoretical concentration, the observed con centration, and the recovery value. The recovery value was the difference between the observed concentration and the theoretical concentration of the test sample. As the recovery yields fell within (100 ± 2.0)%, all of the recovery yields were regarded as acceptably qualified. Analysis of samples. Ten suncare products that could be available commercially and that contain various combinations of the concentrations of sunscreen agents were assayed
Purchased for the exclusive use of nofirst nolast (unknown)
From: SCC Media Library & Resource Center (library.scconline.org)