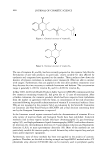
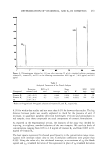
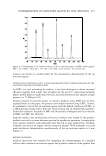
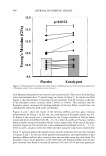
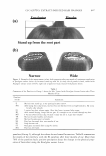
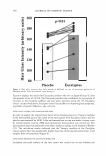
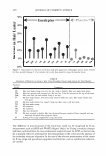
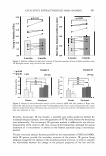
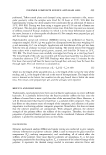
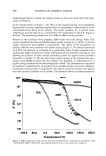
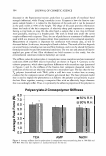
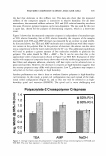
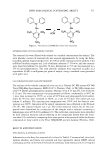
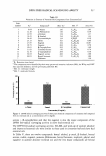
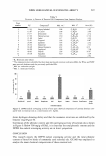
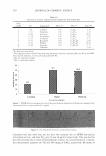
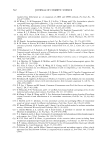
12.0 _ 11.s � ,:a.. c., ';' 11.0 = "CS 10.5 = fl.l --r 10.0 = = � 9.5 9.0 EUCALYPTUS EXTRACT-INDUCED HAIR CHANGES p=0.0118 - fl.l 1/ ·-..., = t � ..., :=---=== • ;Ei _________. - ·-�c fl.l � = fl.l fl.l = c., ·- � = 0 months 2 months 300 250 200 150 100 p=0.0029 I I .� ____________. 0 months 2 months 491 --1 ! I I i Figure 8. Bending stiffness and hair gloss intensity of Caucasian panelists (Group 4) before and after using 3% Eucalyptus extract scalp lotion for two months. *:p0.05 Panelist S PanelistM **:p0.01 t-test (N=23) (N=23) 420 ** 680 � * � Q, 400 ** Q, 640 ** � 380 ** 600 "O "O ** 0 0 � 360 � 560 -bO -bO d d = 340 g 520 0 - - 320 480 Placebo Eucalyptus Placebo Eucalyptus Figure 9. Results of nano-Indentation analysis in hair cortex by AFM. Left side: panelist S. Right side: panelist M. Two pieces of new growth of hair from Eucalyptus extract lotion-treated and placebo side, in each panelist, respectively. Nano-indentation was carried out at 25 points on each hair. The highest and lowest data were neglected at !-test. Recently, microscopic IR has become a powerful and useful analytical method for studying biological samples, since the appearance of FT-IR could shorten the measuring time dramatically. The microscopic IR spectrum method is sufficient for the selective measurement of the cortex in the cross section of the human hair, although the spatial resolution of 4 micrometer is inferior to the Raman spectrum using a microscopic method. Tertiary structural analysis becomes possible by the measurement of XRD and NMR, while IR spectra provide the secondary structure of the protein. IR spectra being adequate enough for the analysis of the secondary protein structure, in order to consider the relationship between the change in the physical properties of the hair and the

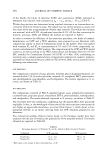
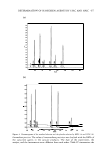
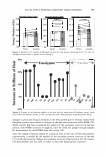
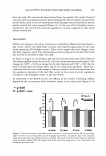
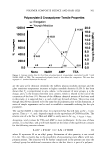
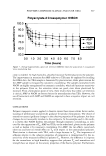
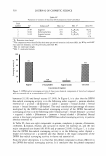
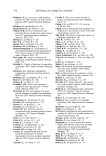
492 � rlJ ·- = � = b ·- ..c = '-" c ·- rlJ = � � a � rlJ ..... ·- = � = ... ·- ..c ... = '--" C ·- rll = � .... � b 1600 1400 1200 1000 800 600 400 200 108 107 106 105 104 103 102 101 0 0 JOURNAL OF COSMETIC SCIENCE 2 20 30 Angle( B) 4 6 Angle( 8) o Eucalyptus : • P1acebo 40 o Eucalyptus ePlacebo 8 50 Figure 10. (a) Results of W AXD analysis: closed marker indicates results from EucalyptuJ extract scalp lotion-treated hair open marker indicates results from placebo scalp lotion-treated hair. (b) Results of SAXS analysis: closed marker indicates results from EucalyptuJ extract scalp lotion-treated hair open marker indicates results from placebo scalp lotion-treated hair. secondary protein structure, we carried out secondary structural analysis using IR spectra of the hair. We measured 36 points per hair on eight hair fibers from both the new-growth part from the Eucalyptus-treated hair and the placebo-treated hair, which were about 5 mm
Purchased for the exclusive use of nofirst nolast (unknown)
From: SCC Media Library & Resource Center (library.scconline.org)