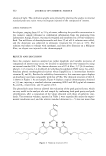
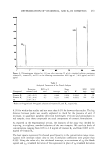
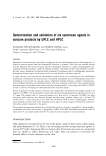
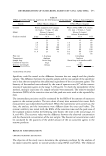
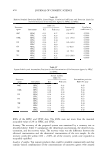
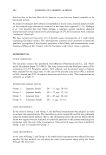
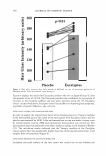
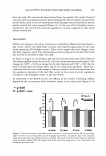
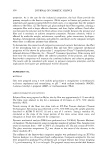
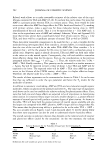
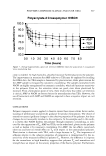
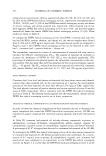
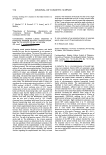
POLYMER COMPOSITE SCIENCE AND HAIR GELS 503 8 7 -- Peak Force 6 i Peak Width at - 5 z 95% Peak Height ._. m 4 � 0 3 LL 2 1 a Distance (mm) or Time (s) Figure 3. Sample data for the three-point bend stiffness test. Force versus time is measured stiffness is calculated as the peak force, and crispness is calculated as the width of the peak at 95% of the height. counterion has the strongest ionomer effect without plasticization, and the TEA coun terion has the weakest ionomer effect and causes considerable plasticization. The iono meric crosslinking and plasticization effects appear to cancel each other out for AMP, and the T g is nearly unchanged from that of the acid form. Therefore, with respect to fixative applications involving acrylic copolymers with acid functional groups, NaOH may be used to make the polymer harder, AMP may be used to maintain the hardness of the acid form of the polymer,1 and TEA may be used to soften a polymer that has a tendency to crack and flake but may cause an increase in tack (if the T g is lowered to below room temperature). PERFORMANCE PROPERTIES If the composite theory presented here holds, then fixative performance tests should be able to probe the adhesive as well as the cohesive properties of the polymer. Two of the most important fixative performance tests are stiffness and crispness. A three-point bend method developed from a standard test for composite materials (17) was used to measure the stiffness and crispness of fixative composite samples. The data from this test can be plotted as force versus time, as shown in Figure 3. The stiffness of the fixative composite is defined as the force needed to bend or break the hair composite for this method, stiffness is measured as the peak force of flexure instead of Young's modulus or work. As 1 The AMP polymer has the same T g as the acid form of the polymer under dry nitrogen conditions. At higher humidity conditions, the T g may be lower since neutralization of the acid groups increases the hydrophilicity of the polymer.

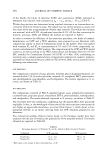
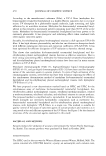
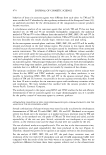
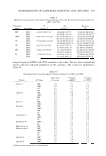
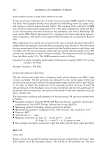
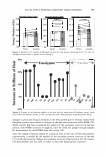
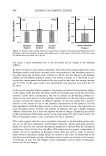
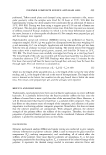
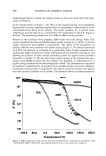
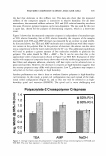
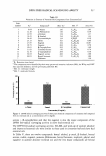
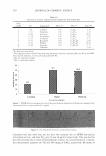
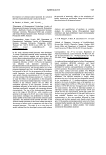
504 JOURNAL OF COSMETIC SCIENCE discussed in the Experimental section, peak force is a good probe of interfacial bond strength (adhesion), while Young's modulus is not. Crispness is how the fixative com posite sample breaks it is related to the sharpness of the peak and it can be measured as the peak width at 95% of the height. The shape of the peak provides information about the break of the hair composite. A relatively sharp peak represents a composite having a crisp break, or snap. On the other hand, a sample that is not crisp will break more gradually, resulting in a broader peak. The work to break (area under the curve) couples stiffness with crispness. Thus, the use of peak force as a measure of stiffness and peak width as a measure of crispness allows these parameters to be evaluated separately. Measurement of crispness is important for correlation with sensory data, as will be discussed below. In this test, the sample is flexed to failure. The mode of failure depends on several factors, including test rate and film thickness, and it can be altered by fixative formulation additives and environmental conditions. The test rate and amount of fixative applied per gram of hair (film thickness) are held constant in this study, but the environmental conditions (relative humidity) are varied. The stiffness values for polyacrylate-2 crosspolymer versus neutralizer and environmental conditions (50% and 90% relative humidity) are shown in Figure 4. Contrary to the cohesive properties, which show significant differences with neutralizer type (presented in Figures 1 and 2), the stiffness of the fixative-hair composite measured under the conditions of this test are relatively insensitive to neutralizer type. The fact that the low T 8 polymer (neutralized with TEA) yields a stiff hair tress is taken here as strong evidence for the composite nature of fixative gel-treated hair. The basic physical model that is used to explain the phenomena is as follows: the polymer acts primarily to glue the hair fibers together, creating a composite fiber with an effectively larger diameter that is accordingly stiffer. Thus, it is primarily the adhesive properties of the polymer to .--- 8.0 z ;- 7.0 � 6.0 0 u. 5.0 � ! 4.0 a, 3.0 en 2.0 cu 1.0 CC 0.0 Polyacrylate-2 Crosspolymer Stiffness TEA AMP ■ 50% R.H. lIIl 90% R.H. NaOH Figure 4. Average stiffness data for polyacrylate-2 crosspolymer versus neutralizing base at 50% RH and 90% RH. The error bars represent ± 1 standard deviation for the test.
Purchased for the exclusive use of nofirst nolast (unknown)
From: SCC Media Library & Resource Center (library.scconline.org)