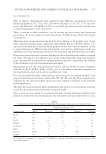
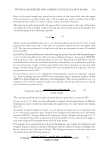
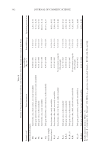
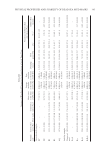
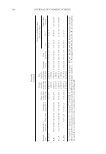
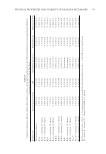
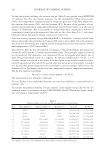
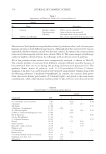
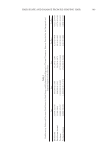
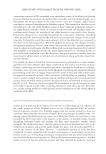
Table IV Summary of Separation, pH, Spreadability, Extrudability, and Loss on Drying Testing Results for the in-House Formulations Containing Ethanol at Different Concentration Levels, at Initial Time Point Formula code a Separation percent (w/w) pH Spreadability (kg·cm·s -1 ) Extrudability (g) LOD percent (w/w) Mud without additives 8.85 ± 0.02 7.97 ± 0.02 0.053 ± 0.008 6.63 ± 0.12 35.25 ± 0.78 K 15 G 2.98 ± 0.41 8.12 ± 0.03 0.025 ± 0.003 5.40 ± 0.16 33.00 ± 0.29 K15G—containing 1% ethanol 4.64 ± 0.20 7.99 ± 0.01 0.059 ± 0.007 5.47 ± 0.28 32.44 ± 0.34 K15G—containing 5% ethanol 6.80 ± 0.90 8.04 ± 0.03 0.029 ± 0.002 15.72 ± 0.40 36.72 ± 0.13 B 10 G 8.02 ± 0.52 7.93 ± 0.03 0.217 ± 0.043 9.17 ± 0.38 35.75 ± 0.19 B10G—containing 1% ethanol 7.37 ± 0.57 7.88 ± 0.02 0.107±0.009 9.17 ± 0.38 36.83 ± 0.57 B10G—containing 5% ethanol 11.09 ± 0.07 8.01 ± 0.01 0.255 ± 0.054 14.63 ± 0.21 37.84 ± 0.03 K5BG5 4.99 ± 0.36 8.24 ± 0.03 0.099 ± 0.010 5.61 ± 0.27 35.83 ± 0.39 K5B5G—containing 1% ethanol 5.46 ± 0.45 8.23 ± 0.08 0.277 ± 0.027 5.96 ± 0.23 37.01 ± 0.08 K5B5G—containing 5% ethanol 8.66 ± 0.25 8.20 ± 0.01 0.250 ± 0.035 6.30 ± 0.17 38.14 ± 0.81 K5B5 4.26 ± 0.95 8.02 ± 0.01 No movement 6.52 ± 0.21 32.45 ± 0.06 K5B5—containing 1% ethanol 4.46 ± 0.24 8.00 ± 0.01 No movement 6.01 ± 0.22 32.66 ± 0.45 K5B5—containing 5% ethanol 5.98 ± 0.36 7.97 ± 0.01 0.114 ± 0.016 11.10 ± 0.46 34.96 ± 0.35 N 0.05 G 7.03 ± 0.88 8.32 ± 0.01 0.180 ± 0.022 7.66 ± 0.34 36.93 ± 0.67 N0.05G—containing 1% ethanol 6.97 ± 0.78 8.28 ± 0.03 0.122 ± 0.011 13.70 ± 0.53 36.19 ± 0.69 N0.05G—containing 5% ethanol 8.90 ± 0.30 8.15 ± 0.07 0.066 ± 0.003 15.40 ± 0.47 37.59 ± 0.36 Results represent mean ± SD (n = 3 for separation percent, spreadability and extrudability tests and n = 2 for LOD percent and pH tests). a K = kaolin, B = bentonite, N = Natrosol 250 HHX, G = glycerin. PHYSICAL PROPERTIES AND STABILITY OF DEAD SEA MUD MASKS 353

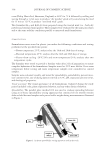
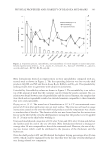
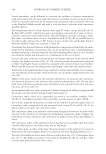
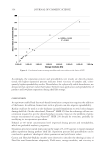
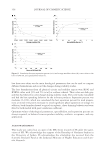
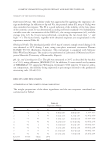
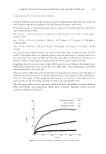
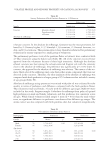
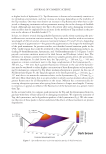
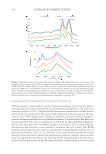
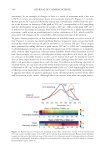
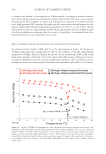
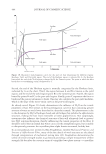
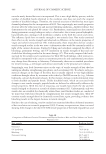
JOURNAL OF COSMETIC SCIENCE 354 Accordingly, the separation percent and spreadability test results are directly propor- tional the higher separation percent indicates lower viscosity of samples and, conse- quently, higher spreadability results. Nevertheless, for a physically stable formulation, we always need an optimum value that balance between easy application and spreadability of product and low phase separation during shelf life storage. CONCLUSION An optimum stable Dead Sea mud–based formulation composition requires the addition of thickeners. In addition, humectants such as glycerin can also improve spreadability. Kaolin could not be used as a sole thickener in mud formulations to avoid color changes during shelf life. On the other hand, Natrosol® HHX 250 has the advantage of low con- centration required to get the desired product viscosity however, the problem of gritty texture encountered on using Natrosol® HHX 250 should be overcome, probably by modifying its incorporation procedure. Ethanol at 5% (w/w) concentration level improved drying percent and extrudability, which are preferable aesthetic properties. Separation percent at initial time point in the range of 5–10% appears to ensure minimal phase separation during product shelf life. Separation percent and spreadability can be correlated to products’ rheological elastic parameters and yield stress values. Casson and Herschel–Bulkley models were observed to describe the rheological data of Dead Sea mud formulations adequately. Yield stress, storage modulus, and viscosity at Figure 6. Correlation between storage modulus and stress values at the limit of LVE.
Purchased for the exclusive use of nofirst nolast (unknown)
From: SCC Media Library & Resource Center (library.scconline.org)