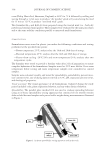
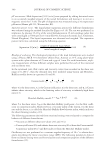
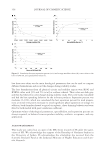
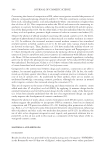
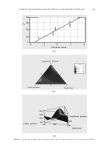
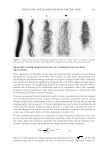
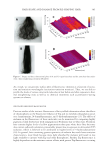
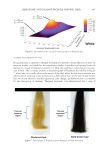
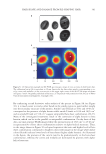
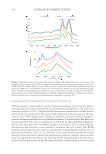
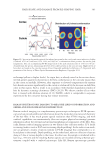
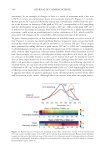
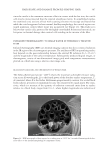
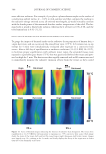
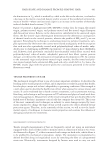
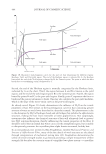
HAIR SHAPE AND DAMAGE FROM RE-SHAPING HAIR 391 By conducting second derivative order analysis of the spectra in Figure 9A (see Figure 10), it is much easier to resolve other bands in the amide region to gain further insight into the secondary structure of the protein. Amide I and II bands at 1652 and 1548 cm-1 correspond to the presence of alpha keratin while amide I bands at 1630 and 1695 cm-1 and an amide II band at 1516 cm-1 suggest antiparallel beta sheet conformation (20,27). Many of the investigated treatments result in the conversion of alpha keratin to beta keratin, which can be in the parallel or antiparallel conformation. On the basis of this data, one may generate FT-IR images where the intensity ratio of 1516 cm-1 to 1548 cm-1 is representative of beta sheet conformation relative to alpha-helical structure. Thus, in the image shown in Figure 10 each pixel represents this ratio and higher levels of beta sheet conformation correspond to brighter colors (red/orange) in the image while darker colors (bluish) indicate lower levels of beta sheets (higher alpha keratin). As illustrated in the fi gure, the proteins of the cuticle tend to be predominantly in the beta sheet conformation, whereas the cortex and medulla are dominated by proteins with alpha- helical structure. Figure 8. (A) Optical micrograph and (B) FT-IR spectroscopic image of cross sections of dark brown hair. The calibration bar in (A) is equivalent to 20 μm. Spectra for the three white pixels—corresponding to cu- ticle, cortex, and medulla—in the cross section in the upper right corner of the (B) FT-IR image are shown in Figures 5 and 6. Originally published in Reference 25. Reprinted with permission of the Society of Photo Optical Instrumentation Engineers, Copyright 2011.

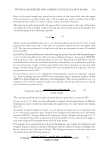
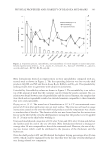
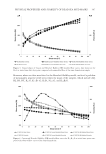
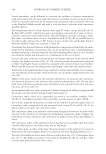
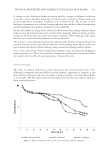
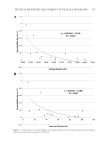
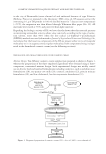
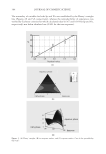
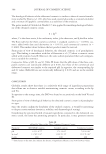
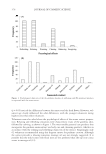
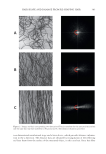
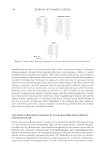
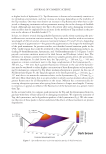
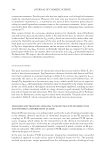
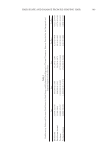
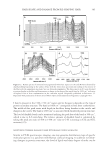
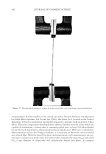
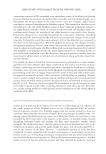
JOURNAL OF COSMETIC SCIENCE 392 MONITORING PROTEIN CONFORMATION IN THERMALLY EXPOSED HAIR Thermal exposure of hair results in surface and internal damage to its structure. This is not surprising since many commercially available thermal styling devices can reach tem- peratures as high as 230°C, well beyond the denaturation temperature of alpha keratin and reaching its melting point. Not surprisingly, and based on the discussion in the pre- vious section, FT-IR spectroscopic imaging is perfectly suited for studying changes in protein conformation brought about by thermal treatments. A detailed look at hair fi ber cross sections exposed to a fl at iron at a temperature of 230°C for 12 min is provided in Figure 11 (Please note that this was a treatment regimen consisting of 12 s per pass with the fl at iron on a hair tress for a total cumulative treatment time of 12 min). This FT-IR spatially resolved spectroscopic image was generated by taking the peak intensity ratio of spectroscopic bands at 1516 cm-1 to 1548 cm-1. (The reader should note that the second derivative curves are used to identify the peak positions however, intensity ratios are taken from the original spectra.) Hence, the resulting FT-IR image provides a measure of the level of beta keratin present in the specimen (with blue corresponding to low levels and Figure 9. Infrared spectra for the white pixel regions in Figure 8B sampled from the cuticle, cortex, and medulla. (A) Spectra in the 1000–1800 cm-1 region of the infrared spectrum corresponding to amide I (1652 cm-1) and II (1648 cm-1) bands. (B) Spectra in the 2800–3700 cm-1 region of the infrared spectrum illustrating the symmetric (2850 cm-1) and asymmetric (2924 cm-1) stretching of C–H bonds in the lipid methylene groups and C–H bonds in lipid methyl groups (2960 cm-1). The peak at 3300 cm-1 in (B) is assigned to N–H stretch- ing in protein. See text for further explanation. Originally published in Reference 25. Reprinted with per- mission of the Society of Photo Optical Instrumentation Engineers, Copyright 2011.
Purchased for the exclusive use of nofirst nolast (unknown)
From: SCC Media Library & Resource Center (library.scconline.org)