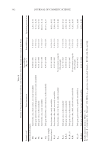
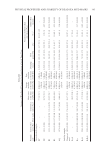
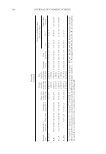
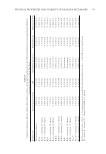
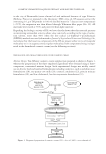
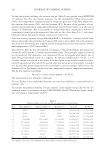
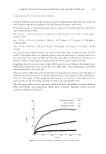
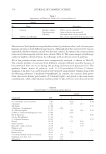
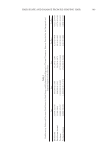
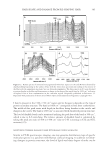
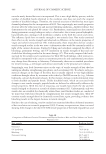
COSMETIC CREAM WITH AQUEOUS EXTRACT AND DATE FRUIT SEED OIL 363 STABILITY OF THE SELECTED FORMULA Experimental Design. The stability study was approached by applying the experience de- sign methodology. In addition to Sp and Vis, the peroxide index (PI, meq of O2/kg) was also considered as response. The PI is a good indicator of the stability of the fatty phase of the cosmetic cream. It was determined according to French standard (35). Independent variables were the concentration of the DSO (x1), the storage temperature (x2), and the storage time (x3). So, 8 tests were performed, considering the two levels (low “−” and high “+”). The factor levels, together with obtained responses are recapitulated in the experience matrix (Table II). Rheological Profi le. The rheological profi le of 0.5 mg of cosmetic sample stored during 24 h was obtained at 20°C during 2 min, using cone-plate rotational viscometer Thermo HAAKE VT-550 (Karlsruhe, Germany). This instrument is equipped with Software Rhéo Win Data Manager. The analysis was performed in Laboratory of Mineral and Com- posite Materials (University of Boumerdès, Algeria). pH, Sp, and Centrifugation Test. The pH was measured at 20°C as described by Anchisi et al. (16), using pH-meter JENWAY-3510. In addition, Ct was carried out by means of HERMLE-Z 323 apparatus (Wehingen, Germany) (3000 rpm for 30 min) at ambi- ent temperature, the stability being expressed as percentages referred to the graduated measuring tube (10 ml) (16). RESULTS AND DISCUSSION OPTIMIZATION OF THE COSMETIC CREAM COMPOSITION The weight proportions of the three ingredients and the two responses considered are summarized in Table I. Table II Experience Matrix No x1 x2 x3 PI Sp Vis 1 −1 −1 −1 4.49 ± 0.47 0.86 ± 0.07 3.33 ± 3.17 2 −1 −1 +1 6.42 ± 1.34 9.24 ± 1.97 32.56 ± 5.60 3 −1 +1 −1 5.78 ± 1.27 8.68 ± 0.18 26.78 ± 5.60 4 −1 +1 +1 8.43 ± 0.19 12.36 ± 0.94 31.66 ± 2.74 5 +1 −1 −1 6.41 ± 0.19 9.52 ± 1.97 34.09 ± 5.37 6 +1 −1 +1 6.13 ± 2.83 8.83 ± 1.50 36.60 ± 2.04 7 +1 +1 −1 14.53 ± 0.97 9.07 ± 0.26 30.99 ± 1.91 8 +1 +1 +1 10.13 ± 2.61 7.95 ± 0.38 26.26 ± 2.05 Level (−) 0.01% 4 days 20°C Level (+) 0.1% 30 days 50°C

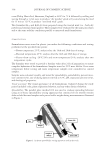
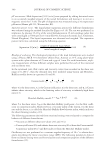
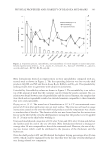
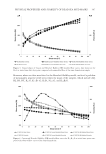
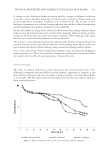
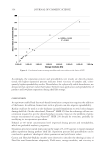
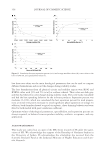
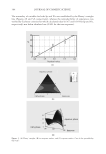
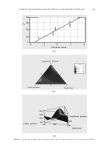
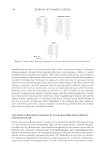
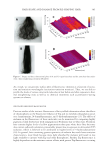
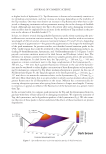
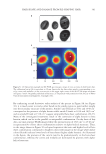
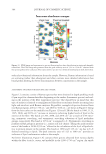
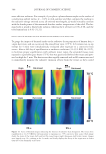
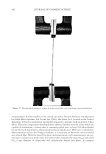
JOURNAL OF COSMETIC SCIENCE 364 The normality of variables for both Sp and Vis was established by the Henry’s straight line (Figures 2A and 3A, respectively), whereas the reproducibility of experiences was verifi ed by Cochrane criterion for which calculated value (0.367 and 0.364 for Sp and Vis, respectively) was below tabulated one (0.801 for the two responses). Figure 2. (A) Henry’ straight, (B) iso-response surface, and (C) response surface. Case of the spreadability (Sp) (cm2).
Purchased for the exclusive use of nofirst nolast (unknown)
From: SCC Media Library & Resource Center (library.scconline.org)