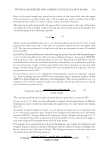
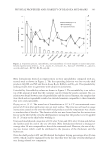
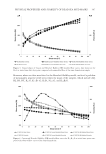
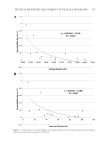
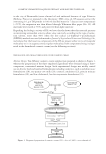
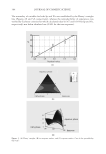
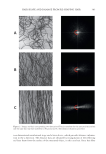
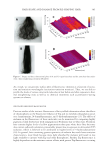
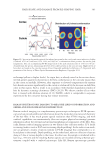
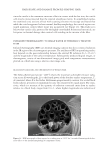
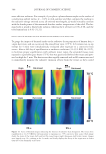
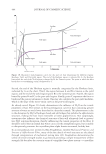
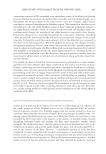
HAIR SHAPE AND DAMAGE FROM RE-SHAPING HAIR 395 I band is present in the 1500–1720 cm-1 region and its frequency depends on the type of protein secondary structure. The band at 1668 cm-1 corresponds to beta sheet conformation. The width of this peak varies with depth in the fi ber, being broader in the cuticle and sharper in the cortex. The band at 1685 cm-1 is associated with disordered protein structure. The level of disulfi de bonds can be monitored utilizing the peak data of the band at 509 cm-1, which is due to S–S stretching. The relative amount of disulfi de bond is calculated by taking the peak area ratio of 509 to 1448 cm-1 (due to C–H scissoring in CH2 and CH3 moieties) (25). MONITORING THERMAL DAMAGE IN HAIR WITH RAMAN CONFOCAL IMAGING Similar to FT-IR spectroscopic imaging, one may generate distribution maps of specifi c molecular species in a specimen with Raman confocal imaging. In addition to follow- ing changes in protein structure, the level of lipids and their degree of order can be Figure 12. Raman spectra of untreated non-pigmented white hair. Spectra in (A) and (B) were obtained by depth profi ling beginning at the surface of hair with the lower most spectrum and ending in the interior of the fi ber with the uppermost spectrum. See text for peak assignments. The three spectra in (C) were obtained at various depths in the fi ber and demonstrate a change in the shape of the amide band at 1668 cm-1 indicative of higher levels of beta conformation in the cuticular region. Originally published in Reference 25. Reprinted with permission of the Society of Photo Optical Instrumentation Engineers, Copyright 2011.

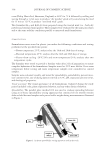
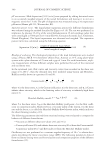
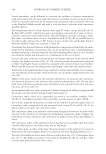
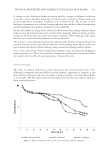
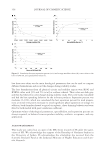
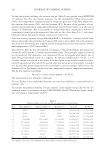
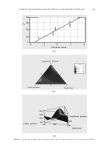
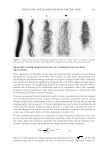
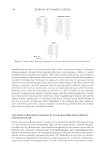
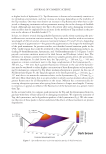
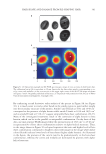
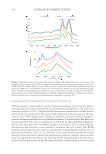
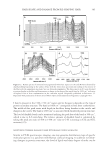
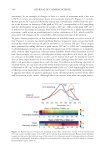
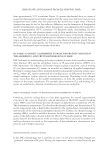
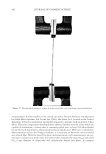
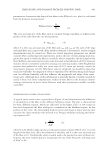
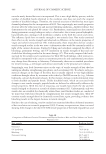
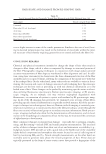
JOURNAL OF COSMETIC SCIENCE 396 monitored. As an example of changes in hair as a result of treatment with a hot iron (230°C, 12 min see explanation above for treatment protocol), Figure 13 contains Raman spectra for virgin and thermally treated hair. Immediately evident from the spec- tra is the decrease in intensity of the peak at 509 cm-1 corresponding to S–S stretching and the development (or an increase) of a peak at 487 cm-1. This second peak (487 cm-1) is believed to arise from an isomeric form of the S–S bond (30). It is likely that thermal treatment could result in transformation to other conformers of S–S, which could be associated with changes in the overall three-dimensional structure of the protein. To gain a better perspective on the distribution of disulfi de bonds in a cross section of hair, Figure 13 contains two depth profi ling Raman images for virgin versus thermally treated hair from the exterior (0 μm) of the fi ber to its interior (40 μm). These images were generated by taking the ratio of peak area at 509 cm-1 to 1004 cm-1 corresponding to phenylalanine present in the protein. On inspection of the images, it is immedi- ately evident that virgin hair contains more disulfi de bonds than thermally treated hair. Interestingly, we can see a distribution within virgin hair itself where the great- est amount of disulfi de bonds is in the cuticle region (0–5 μm). It should be noted that in these experiments we do not obtain accurate readings from the other side of the fi ber (40 μm) due to signal decay with the laser. In addition to following the level of disulfi de bonds, we can also look at the newly formed isomeric species by taking the ratio of the band at 487 cm-1 to the phenylalanine band (1004 cm-1). Not surprisingly, the level of this species in virgin hair is extremely low (see Figure 13). In thermally treated hair, it appears that there are greater quantities in the internal portion (cortex) of the fi ber and less present in the cuticle. Although this is in contrast with what one might expect, Figure 13. Raman spectra of virgin and thermally treated hair containing a normal S–S stretching band (509 cm-1) and a possible isomer of S–S (487 cm-1) resulting from thermal exposure. Raman depth profi ling images provide spatial distribution maps of the natural S–S conformation and its damage-induced conformer in healthy and thermally treated hair. Images were normalized by taking the ratio of these bands to a protein phenylalanine band at 1004 cm-1.
Purchased for the exclusive use of nofirst nolast (unknown)
From: SCC Media Library & Resource Center (library.scconline.org)