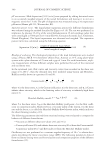
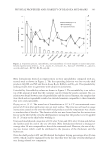
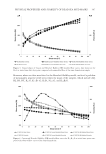
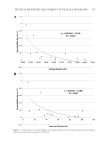
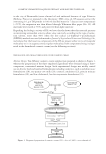
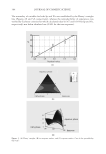
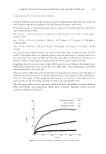
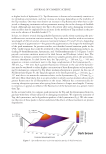
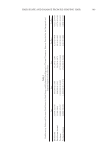
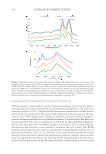
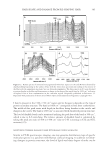
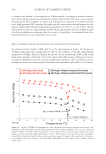
HAIR SHAPE AND DAMAGE FROM RE-SHAPING HAIR 403 parameter to characterize the shape of hair fi bers is the Elliptical ratio, which is calculated from the diameter measurements: min Dmax Elliptical ratio D (3) The cross-sectional area of the fi ber, used to calculate Young’s modulus, is defi ned as the product of the radii from the two measurements: πr max min = A r (4) where A is the cross-sectional area of the fi ber and rmax and rmin are the radii of the large and small fi ber axes, respectively. After the fi ber diameter is determined, tensile strength measurements may be carried out. There are several important parameters one should consider when conducting such experiments, such as the rate of strain during load elon- gation (the speed at which the fi ber is extended), relative humidity, and the length of the fi ber. Robbins cites relatively fast strain velocities used in his laboratory (0.05% strain per minute), which is extremely useful for carrying out screening studies, while Feughelman presents data gathered at really low strain rates (0.01% strain per minute), mostly for investigative purposes (41,42). Whichever velocity employed, we should be aware that strain rate will affect the magnitude of forces experienced by the fi ber during load elonga- tion. In addition, humidity will also infl uence the magnitude and shape of the stress– strain curve. Although most of this information is generally known, it would certainly be useful if there were more comprehensive studies on hair fi bers in the literature demon- strating correlations in stress–strain behavior with these paramount variables carefully controlled. INTERPRETATION OF STRESS–STRAIN CURVES A typical stress–strain curve is provided in Figure 18 and demonstrates the difference in extensibility of the fi ber at two different hydration levels. The plot is characterized by three different regions, which are indicated in the fi gure. First, at low strain (or low load elongation) the fi ber undergoes a transition in the Hookean region. In this portion of the curve, the relationship between stress and strain is linear and one may calculate the elastic modulus (also referred to as Young’s modulus) utilizing the follow- ing equation (41): gL = H E A%L (5) where H is the Hooken slope (g/cm), g is the gravitational constant (980.6 cm/s2), L is the length of the fi ber (cm), ΔL is the extension of the fi ber, and A is the cross-sectional area of the fi ber (cm2). Traditionally, elastic moduli used to be reported in units of dynes/cm2 however, the more modern practice incorporates the use of the SI system, utilizing units of N/m2 or Pa.

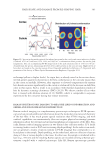
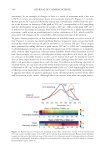
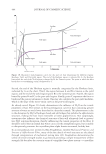
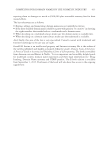
JOURNAL OF COSMETIC SCIENCE 404 Second, the end of the Hookean region is normally categorized by the Hookean limit, indicated by A on the chart. Third, the region between A and B is known as the yield region and the end of the yield region (point B) is the turnover point. Fourth, the region bound by points B and C is the post-yield region. Finally, point C represents the force to break and the percent extension to break. One may also calculate the post-yield modulus, which is the slope of the stress–strain curve in the post-yield region. As already noted, Figure 18 clearly demonstrates the infl uence of H2O on the tensile properties of hair. The stresses in the load-elongation curve for hair containing greater amounts of water are much lower than that for a dryer hair sample. This phenomenon is due to the disruption by H2O of hydrogen bonds and salt bridges that stabilize the alpha keratin structure, making the hair more extensible at lower applied forces. Not surprisingly, treatments that infl uence the chemical structure of hair will ultimately lead to greater/ less H2O sorption/desorption, thereby infl uencing the tensile properties of the fi ber. It should be noted that in normal hair water can access the amorphous region, but is unable to ubiquitously penetrate the crystalline phase alpha keratin in normal, healthy hair. In an extraordinary text written by Max Feughelman, entitled Mechanical Properties and Structure of Alpha-keratin Fibres, many of the fi ne details of wool structure are elucidated through interpretation of mechanical testing data (42). Feughelman demonstrates the utility of tensile strength studies to go beyond providing a simple measurement of fi ber strength. He describes the cortex in terms of a simplifi ed two-phase system—a crystalline Figure 18. Illustrative load-elongation curves for dry and wet hair illustrating the different regions: Hookean, Yield, and Post-yield region. The end of the Hookean region is indicated by, A, the Hookean limit while the end of the Yield region is denoted by B, the Turnover point. The point at which the fi ber breaks due to overwhelming strain is delineated by C.
Purchased for the exclusive use of nofirst nolast (unknown)
From: SCC Media Library & Resource Center (library.scconline.org)