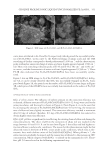
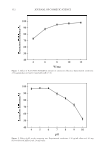
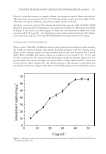
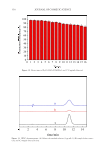
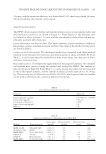
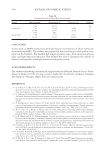
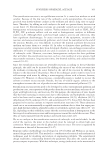
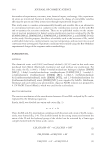
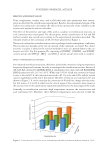
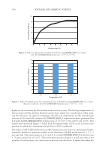
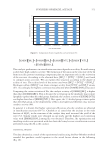
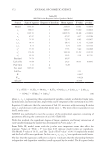
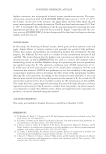
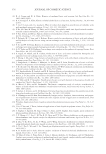
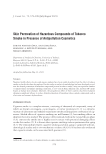
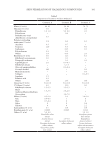
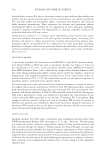
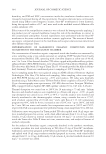
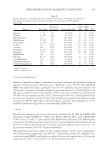
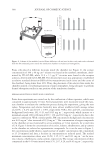
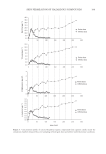
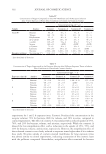
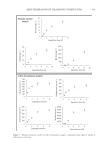
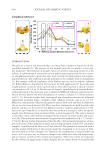
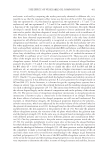
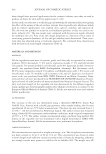
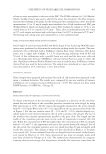
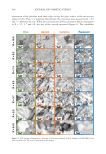
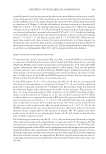
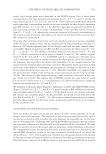
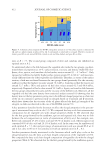
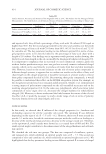
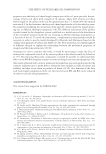
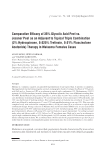
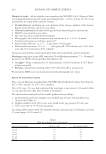
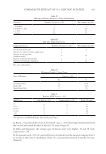
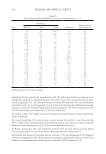
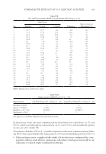
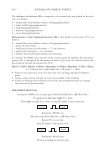
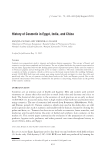
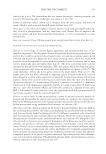
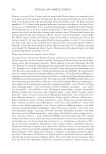
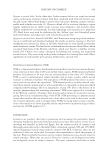
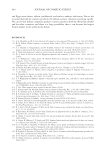
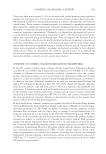
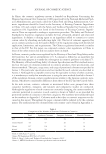
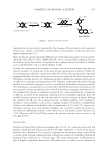
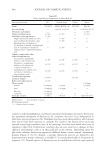
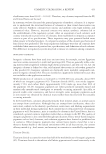
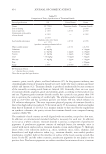
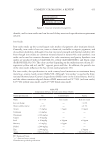
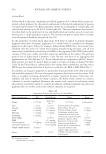
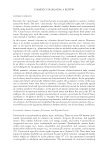
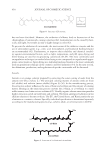
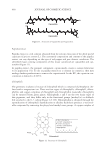
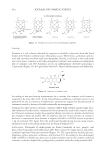
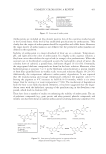
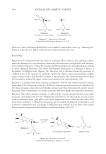
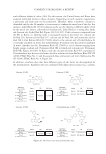
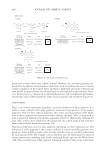
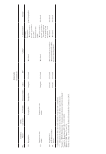
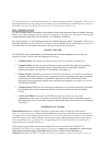
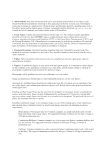
388 JOURNAL OF COSMETIC SCIENCE Franz cells placed at different locations inside the chamber (see Figure 2). An average concentration of 380 ± 40 ng cm−2 toluene was found in the synthetic membrane, deter- mined by TD-GC-MS while 13.9 ± 1.3 µg L−1 nicotine were found in the receptor solution, determined by LC-MS-MS. The obtained precision was appropriate, established as relative standard deviation (RSD) of five measurements (each corner and the center of the chamber), being lower than 10%. Thus, the placement of two electric fans inside the chamber assured a total homogenization of inner atmosphere, being adequate to perform dermal absorption studies in any position of the simulation chamber. DERMAL ABSORPTION IN FINITE DOSE CONDITIONS Finite dose experiment was carried out by the combustion of three cigarettes, which were consumed in approximately 10 min. Several parameters were monitored inside the expo- sure chamber to evaluate the combustion process during the experiment, giving the next values. Temperature and relative humidity were almost unaffected with average values of 24.8°C ± 0.2°C and 40.1% ± 0.9%, respectively. VOCs, CO, and CO 2 concentration background levels were 101, 0.45, and 1045 mg m−3, respectively, which increase to a maximum around 1200 s (20 min) of 8337, 130, and 3021 mg m−3, respectively, due to the cigarette combustion. With a similar profile, PM concentration background concentration was 0.01 mg m−3 that increased till 339 mg m−3. The concentration of target compounds in the chamber air was monitored by active sampling, at 5 min intervals, for a total time of 2 h. Figure 3 shows the concentration of nicotine, toluene, ethylbenzene, and p-cymene in the chamber air, selected as representative compounds. As it can be seen in Figure 3, the concentration profile shows a rapid increase of analyte concentration till a maximum at 15–20 minutes and later, a decrease in concentration at reduced speed. The reached maximum concentration values were 16.58, 3.15, 0.71, and 0.41 mg m−3 air for nico- tine, toluene, ethylbenzene, and p-cymene, respectively. The average concentration of these compounds in the 0–30-min interval were 9.70, 2.07, 0.26, and 0.41 mg m−3, respectively. 12 mL 0.9 % (w/v) NaCl adjusted to pH 7.4 Strat-M 0.7 cm2 0 4 8 12 16 20 A B C D E A B C D E 0 50 100 150 200 250 300 350 400 450 500 A B C D E Figure 2. Scheme of the modified vertical Franz diffusion cell and used in this study and results obtained from the five evaluated points inside the simulation chamber to evaluate air homogeneity. Nicog415ne ( L-1) Toluene(ng cm-2)

389 SKIN PERMEATION OF HAZARDOUS COMPOUNDS 0.0 5.0 10.0 15.0 20.0 25.0 30.0 35.0 40.0 0 50 100 150 200 250 300 0.0 2.0 4.0 6.0 8.0 10.0 12.0 14.0 0 50 100 150 200 250 300 0 1 1 2 2 3 0 50 100 150 200 250 300 0.0 0.1 0.2 0.3 0.4 0.5 0.6 0.7 0.8 0.9 1.0 0 50 100 150 200 250 300 g415me (min) Finite dose Infinite dose Finite dose Infinite dose Finite dose Infinite dose Finite dose Infinite dose Figure 3. Concentration profile of selected hazardous organic compounds from cigarette smoke inside the simulation chamber measured by active sampling in finite (grey dots) and infinite (white dots) dose conditions. Nicog415ne ( L-1) Toluene ( L-) Ethylbenzene(μg L-1) p-cymene(μgL-1)
Purchased for the exclusive use of nofirst nolast (unknown)
From: SCC Media Library & Resource Center (library.scconline.org)