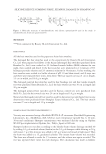
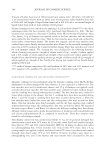
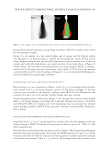
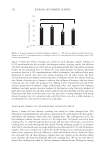
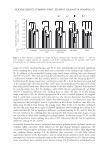
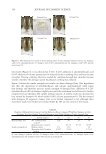
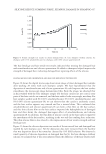
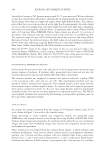
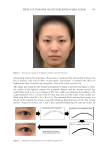
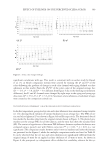
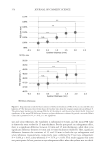
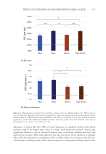
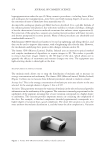
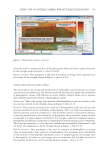
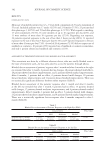
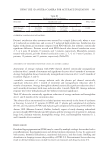
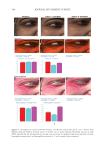
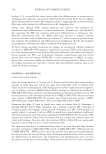
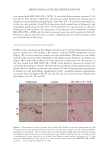
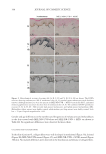
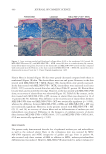
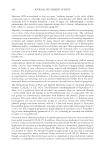
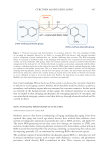
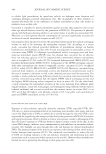
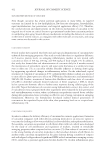
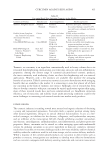
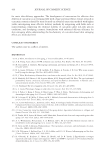
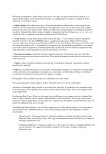
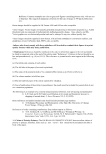
378 JOURNAL OF COSMETIC SCIENCE hyperpigmentation under the eyes (4). Many cosmetic procedures—including lasers, fillers, and autologous fat transplantation—have been used with varying degrees of success, and the outcomes of most of them have been unsatisfactory (5). An injectable autologous plasma gel (filler) has been described. It is a gel-like formula of the ordinary plasma with platelets, but with more stability in volume and shape, although it has the characteristic bioactive molecule secretions that enhance tissue regeneration (6). For correction of the aging face, surgeons are creating more procedures with fewer incisions and shorter postoperative recovery periods. Many of these procedures use absorbable and nonabsorbable sutures (7). Polydioxanone (PDO) threads are known to be used in tightening and lifting the face, and they can be used to improve skin texture, with a brightening effect for the skin. However, the mechanism underlying these positive skin changes remains unclear (8). The Antera 3D® (Miravex Limited, Dublin, Ireland) uses an innovative optical method and complex mathematical algorithms to acquire images in 3D. This makes it possible to extract data from images related to the 3D shape of the skin, which allows one to quantify the efficacy of treatments and monitor changes over time. The equipment uses light-emitting diodes to shine light on the skin. MELANIN MODE IN ANTERA CAMERA The melanin mode allows one to map the distribution of melanin and to measure its average concentration and uniformity. The Antera 3D® (Miravex Limited, Dublin, Ireland) (Figure 1) allows one to measure three different parameters related to melanin content: Average level. This is the average concentration of melanin per unit area relative to the area selected. In the example shown in Figure 2, this is 0.527. Variation. This parameter measures the variation of melanin in the selected area and provides information on the uniformity of the pigment. The variation is inversely proportional to the uniformity of the pigment, meaning that a lower variation corresponds to a higher degree of uniformity. The variation provides important metrics in evaluating the complexion of the skin. For example, a blotched complexion (mottled pigmentation) corresponds to a higher degree of variation than a good complexion. The closer the variation is to zero, the more uniform the melanin distribution is, and the better the skin complexion is. Variation Figure 1. Antera 3D® (Miravex Limited, Dublin, Ireland) camera (9).

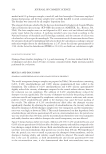
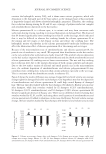
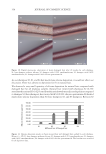
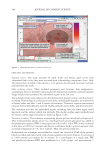
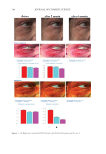
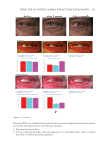
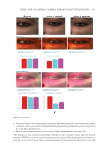
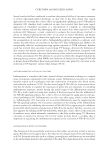
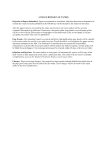
379 Using the 3D Antera Camera for Accurate Evaluation should be used to compare the skin of the same person before and after a given treatment. In the example shown in Figure 2, this is 0.05224. Relative variation. This parameter is the ratio of variation to average level, expressed in a percentage. In the example shown in Figure 2, this is, 9.93%. HAEMOGLOBIN MODE IN ANTERA CAMERA This mode allows one to map the distribution of haemoglobin and to measure its average concentration and uniformity. The software used will automatically display the distribution of haemoglobin. Antera 3D® (Miravex Limited, Dublin, Ireland) allows one to measure three different parameters related to haemoglobin content: Average level. This is the average concentration of haemoglobin per unit area relative to the area one has selected. In the example shown in Figure 3, this is 1.45. Variation. This parameter measures the variation of haemoglobin in the selected area and provides information on the uniformity of the pigment. This is an important parameter in determining how good skin complexion is. The parameter, which is measured by software, is inversely proportional to the uniformity of the pigment this means that a lower variation corresponds to a higher degree of uniformity. For example, a blotched complexion (uneven hemoglobin distribution) corresponds to a higher degree of variation than a good complexion. The closer the variation is to zero, the more uniform the haemoglobin distribution is, and the better the complexion is. In the example shown in Figure 3, this is 1.45 Relative variation. This parameter is the ratio of variation of haemoglobin to average value of haemoglobin. Like variation of haemoglobin, this parameter gives information on the evenness of haemoglobin distribution, but it is weighed against the average value of haemoglobin. Its value in a percentage gives an immediate feel for what the level of haemoglobin uniformity is. In the example shown in Figure 3, this is 13.3%. Figure 2. Melanin mode in Antera camera (9).
Purchased for the exclusive use of nofirst nolast (unknown)
From: SCC Media Library & Resource Center (library.scconline.org)