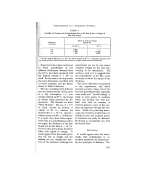
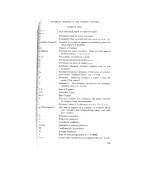
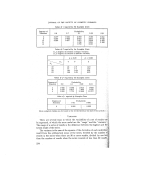
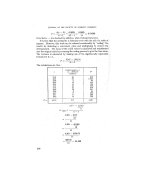
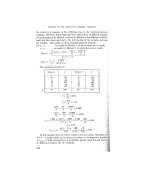
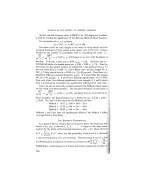
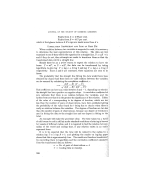
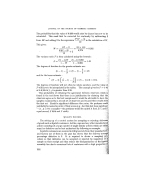
JOURNAL OF THE SOCIETY OF COSMETIC CHEMISTS Our mean is 36-775 and the limits are therefore 36.775 q- 0'462' thus the true mean at p ---- 0.05 lies between 36.313 and 37.237 grams. ' Similarly the limits of p = 0.001 are between 35.843 and 37.707 grams. These limits of the population mean are called the "fiducial limits" at what- -ever probability they are calculated ß hence, the fiducial limits at p = 0-05 are 86.313/37-237 grams, and once in 20 times a sample of 12 drawn at random will give a mean which will not lie within these fiducial limits. US.E OF "t"--COMPARISON' OF RESULTS (a) Results which can be converted to a single series of differences. Two series of results can be compared with each other very easily by using the t function. For example, suppose there to be six samples of an essential oil, each of whose alcohol content has been determined by two different methods. It has to be decided whether there is sufficient evidence to establish that a true difference exists between the two methods at p -- 0.05 level. .:: mean of a series of observations By definition, t •- ß standard deviation of the mean (Standard Error)il •' thus its calculation amounts to the calculation of the mean difference? ,. between the samples due to the method of analysis and of its stan•Iar d deviation. The analytical results and the details of the calculation follow• :" Sample Method 1 Method 2 Difference, x, No. __øz Alcohol • Alcohol (Col. 2--Col. 3) x • /o _ I 26 15 ll 121 2 8 10 -- 2 4 3 14 6 8 64 4 24 31 -- 7 49 5 8 19 -- 11 121 6 17 22 -- 5 25 Sum -- 6 384 N=6 --6 The mean difference- -- -- 1 6 a'= Z'(x') -- ( Zx)*/N _ 384 -- (--6)'/6 -- N--1 5 and the standard deviation of the mean, a m -- 384 -- 6 378 ..... 75.6 5 5 :.• -- %/12.3 -- Making the. hypothesis a "null hypothesis" that there is no between the two methods, there has to be found the probability 238

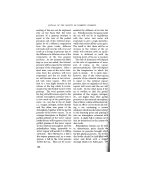
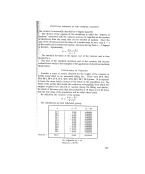
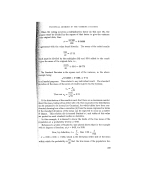
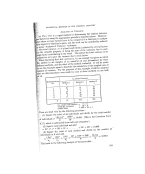
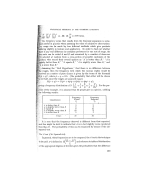
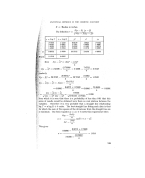
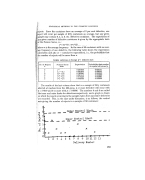
STATISTICAL METHODS IN THE COSMETIC INDUSTRY .:was so the series of results obta/ned were obtained by chance. (If the would not be likely to be due to chance--say, p -- 0.05 or lower-- there must be a difference due to the method.) ß .. t-- d __ --1 __ 0.29. ' ß - rr,• 3.51 the sign of t and referring to the table of its values with 5 d.f. that at p -- 0.8, t ---- 0.27. Thus, the probability that if the methods equal this difference would occur by chance is p -- 0.8, or four in five, it is very probable that there is no real difference between the methods. same samples were analysed by a third method to give tt•e results ß i Method 1 Method 3 Difference 1'4o.
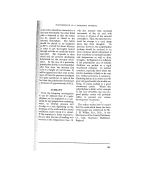
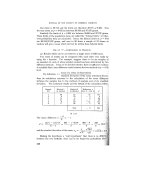
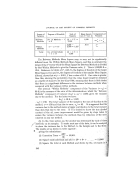
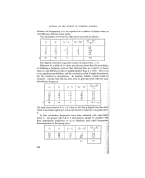
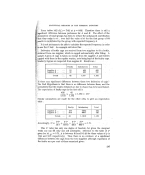
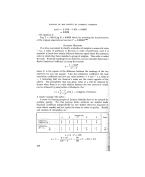
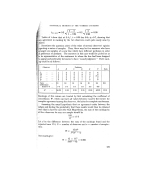
Sample % alcohol % alcohol (1 -- 2) x 2 1 26 52 -26 676 2 8. 24 - 16 256 3 14 35 - 21 441 4 24 43 - 19 361 5 8 34 --26 676 6 17 ' 48 -- 31 961 Sum --- 139 3,371 Mean difference, -- -- 139 -- -- 23'2. •2_ 3,371 -- (139)2/6 _ 30.2. 5 ff3-5- cr,,-• W • --2.24. ?:i. 23-2 -- -- 10-4 for which p is very much smaller than 0-001 "i•. :"• l(.• d/.) 2-24 :(written p 0-001) and it is certain that these two methods give different i•.::i'results It is possible to estimate the fiducial limits of this difference, e.g., •iat p = 0.05, t(5 d.l.)---- 2'57, and the limits are -- 23'2+ 2.57 x 2.24 = ii?.23'2 • 5-75 = 17.45 to 28.95. It can be expected that Method 3 Mll give •?'results between 17.45 and 28.95 per cent higher tkan Method 1 (or Method 2, -Since this has previously been found equal fo Method 1) •))/)/•:• ( It will be seen later that there •e shorter ways of comparing three or •:' :, more series of results (see Analysis of Variance (a)) , ( :• • (•) .Results which must be treated as two series. ' •:/:.:-, In the determination .of alcohol lust considered, analyses were carried •:•:• out on the same sample of oil by two methods, and the difference between ¾:' 239 ,.•
Purchased for the exclusive use of nofirst nolast (unknown)
From: SCC Media Library & Resource Center (library.scconline.org)