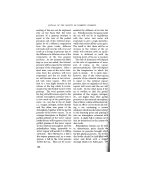
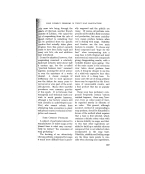
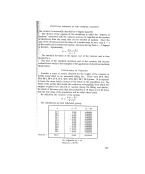
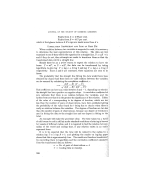
JOURNAL OF THE SOCIET• * OF COSMETIC CHEMISTS the results is a measure of the difference due to the variation between methods. However, if the results had been obtained on 12 different samples, six being analysed by Method 1 and six by Method 2, this difference method could not have been used due to the introduction of the variation between the samples. The results are then analysed using the formula: Let x•, x, ....... be results by Method 1, of which the•e are N results. y•, y• ...... be results by Method 2, of which there are n results. Then •2 [Z•(x •) + ('rx)• (2__y)•] == .N
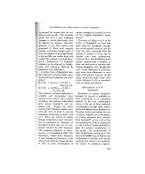
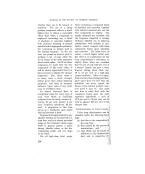
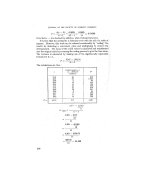
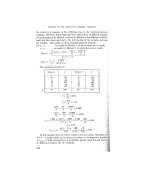
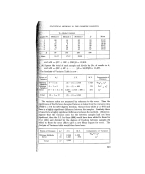
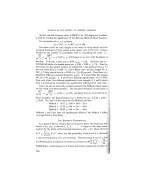
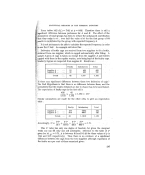
'Z'(y') n N q-n--2 . andt_•--} ./ Nn ' The calculation details are: Method 1 26 676 8 I 64 14 196 24 576 8 - 64 1• 289 Method 2 Y 15 10 6 31 19 22 225 100 36 ß 961 361 484 97 1,865 103 2,167 •:_ 97_ 16.2 6 •_ 103_ 17-2 6 (,rx) 2 97 • 9,409 -- -- -- 1,668 N 6 6 (xy) _ lO,60___0_ 1,768 N 6 6 1,865 q- 2,167 .-- 1,668 -:- 1,768 . 596 ---- -- 59.6 6 +6 --2 10 o = 7'72 16.2 - 17.2 _ 0.2a t(tø •'/) -- 7.72 •-• = 7-72 In this example there are twelve results in two sets of six ' thus therd aV 6 q- 6 -- 2 results which can be chosen at random, i.e. 10 degrees of A too •.•) of 0-23 corresponds to a probability greater than 0-8 and no difference between the two methods. -. '240

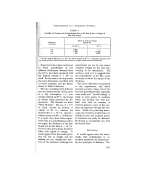
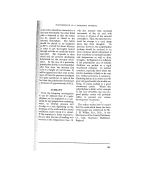
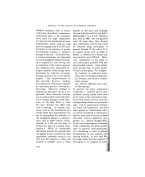
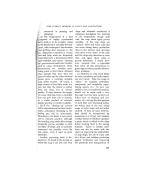
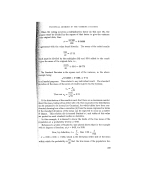
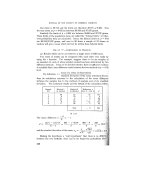
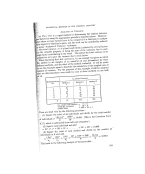
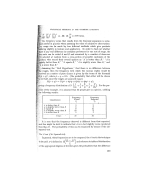
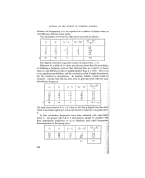
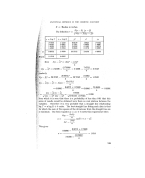
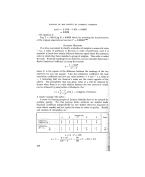
.. STATISTICAL METHODS IN THE cOsMETIC INDUSTRY ANALYSIS OF VARIANCE ß _ . i .The t test is a rapid method of determining the relation between factors by using the appropriate procedure described above. However, three or more factors have to be compared it is laborious to analyse respective relations in pairs, and the work can be considerably reduced '•he}-r-:-• "Analysis of Variance" techmque: ....... • •-'o•veral factors • •i:as' the valuaate propert• This anows the total variance to be factor contributing to me t• ß so as to give the variance due to each factor. discussing the t test, sections (a, b), an example was given in which Mcohol in six samples of an essential oil was determined by three methods, and the effect of the method evMuated. It will be useful use this example again to illustrate the cMculation of the simplest case of of variance. For the purposes of this example, it six determinations were made by each of three methods on one bulk 'a½:•of od.. o, Alcohol Content /o Determination Method 3 No. Method 1 Method • Y 1 26 15 52 2 8 10 24 3 14 6 35 4 24 31 43 5 8 19 34 6 17 22 48 -• 103 236 • 97 •:• :: No. •esults eac• method •: Total •o. of results Grand Total = 436 • •x, y, z. are dealt with by the following procedure' •:•':•(:•':/' (1) Square the total of aU individuals and di•de by the total number (•x,v.,z)' (436)' 10,561 (This is the Correction Term }?:of:individuals = - N 18 ?•'(C.T.) which is subtracted from each sum of squares.) '•:•:.. (2) Square each individual and add = zx,, z = + 8' + ....... + + 48 the number ?.?: (3) Square the total of each method and divide by • individuals in it and add ' 97 • + 103 • + 236 • 75,714 _ 12,619. . ?This leads to the following Analysis of Variance table :':' 241 . 17 :.
Purchased for the exclusive use of nofirst nolast (unknown)
From: SCC Media Library & Resource Center (library.scconline.org)