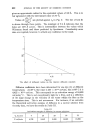
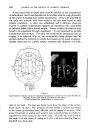
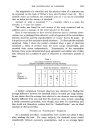
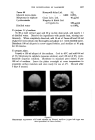
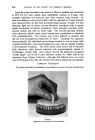
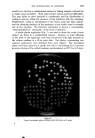
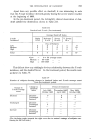
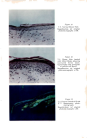
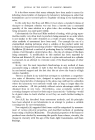
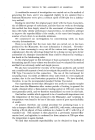
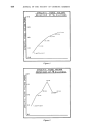
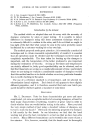
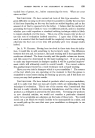
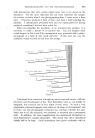
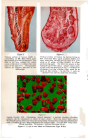
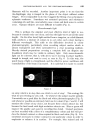
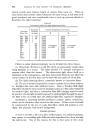
620 JOURNAL OF THE SOCIETY OF COSMETIC CHEMISTS The units of growth were then recorded. Each applicator had 160 teeth, so the maximum number of units (colonies) for 2 plates was 320 (Fig. 8). Colony characteristics were examined by means of a binocular microscope (x 10) and the microscopic appearance of cells was also noted. This technique was not truly quantitative, since numerous organisms on one tooth of an applicator would be classified as a single unit of growth further, we could not be sure that "no growth" always meant "no infection". Nevertheless, the method did appear to provide an approximate repre- sentation of the level of infection. P.ovale in a Clinic Panel In the 18-week period immediately preceding the test, the 19 volunteer subjects had their hair washed in the salon weekly with our standard anionic shampoo. During the treatment period, 5% cetrimide solution was used as a shampoo to avoid interaction of materials on the scalp with the anti- septic selected. Daily treatment, in most cases by the subjects themselves, was carried out with a 0.25% aqueous solution of dequalinium chloride, approximately 5 ml per application. It had previously been shown in vitro that P.ovale was inhibited by dequalinium chloride at 1: 1000. Table II Average count (units of growth) of P. ovale during dequalinium treatment Average Count Pre-Treatment Treatment Subject March-June July-October November 1962- May 1963- No. 1962 1962 April 1963 October 1963 1 238 165 26 108 5 105 210 34 51 6 182 35 8 21 10 120 248 46 76 11 55 13 1 1 14 29 25 0 32 17 39 164 12 8 18 30 69 10 14 During the pre-treatment period, the average recovery of P.ovale units of growth varied between 30 and 240 per subiect, out of 320 units possible. In the first 3 months of treatment, the P.ovale recovery decreased in some cases and increased in others. However, all cases showed a decrease in average P.ovale units during the next 6 months (November 1962 to April 1963), though some of these counts rose again to some extent whilst treatment continued (May to October 1963) data from subjects continuing the full period of investigation are given in Table II.

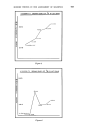
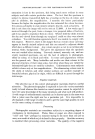
THE INVESTIGATION OF DANDRUFF Apart from any possible effect on dandruff, it was interesting to note that the P.ovale incidence declined greatly during the severe winter weather at the beginning of 1963. In the pre-treatment period, the fortnightly clinical observation of dan- druff yielded the distribution shown in Table III. Table III Dandruff and P. ovale (Pre-treatment). P. ovale Incidence* Low Medium High Average Dandruff Index Slight Moderate I Severe V. Severe 0--•5 5--•10 10-+15 15-+ 6 10 1 Nos. of Subjects 2 1 2 2 0 0 4 3 Total 6 4 17 *Low = 0-+ 50 average count Medium = 50-+150 .... High ---- 150-+320 .... This did not show any strikingly obvious relationship between the P.ovale incidence, and the dandruff level. In the treatment period, the results were as shown in Table IV. Table IV Number of subjects showing changes in dandruff index and P. ovale average count from pre-treatment period. Change in Change in Period of treatment dandruff P.ovale average index July 1962- November 1962- May 1963- count October 1962 April 1963 October 1963 -- Decrease Decrease 3 5 4 Unchanged -- 8 3 Increase -- -- -- Unchanged Decrease -- -- 1 Unchanged 5 -- -- Increase -- -- -- Increase Decrease 6 -- -- Unchanged 1 -- -- Increase -- -- -- , (The declining totals towards the right were due to natural wastage of subjects con- tinuing for the full term.)
Purchased for the exclusive use of nofirst nolast (unknown)
From: SCC Media Library & Resource Center (library.scconline.org)