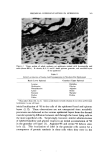
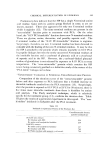
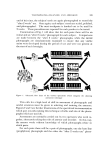
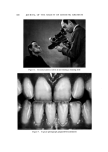
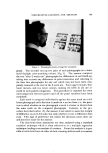
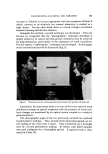
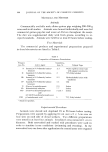
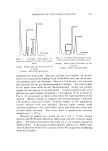
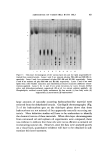
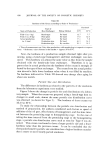
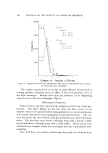
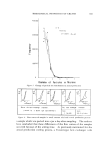
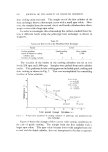
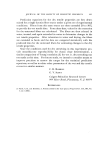
TOOTHPASTES--CLEANING AND kBRASION 601 Figure 4. Photographic prints arranged for assessment graph. The recorder sets up two pairs of such photographs in a simu- lated daylight color-matching cabinet (Fig. 4). The assessor compares the two "after 2 weeks use" photographs for differences in soil build-up, taking into account any differences in print intensities and referring to the base line photographs for any soil which may not have been com- pletely removed at the start of the 2-week test. Four upper incisors, four lower incisors, and two lower canines, making ten teeth in all, are as- sessed in each paired comparison. This procedure is repeated for every intercomparison between pastes until all the panel members have been examined. Each tooth is compared individually against the same tooth on a dif- ferent photograph and a decision is made on a yes/no basis, i.e., the ques- tion is asked whether on one photograph a tooth is cleaner or dirtier than the same tooth on the compared photograph. Contrary to the pro- cedure described earlier (2), the assessor is not asked to assess the margin of difference on an 0-3.0 scale, but only whether or not a difference does exist. This type of preference test makes the decisions more clear cut and therefore easier for the assessor. The data from these assessments are then analyzed using a standard statistical technique which is often referred to as a multiple regression technique leading to an analysis of variance. From this analysis it is pos- sible to rank dentifrices in order of their cleaning abilities and to examine

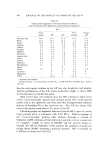
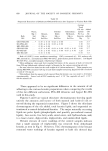
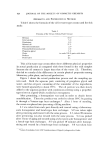
602 JOURNAL OF THE SOCIETY OF COSMETIC CHEMISTS differences between products for statistical significance. To aid in this, the data output is expressed as an hierarchy. For example, a typical result may be communicated as shown in Table II. Table II Ranking of Various Dentifrices in Order of Cleaning Ability Paste G Paste D Paste E Paste B Paste A 0 129 321 399 414 Significant differences Level Difference 1 : 20 146.5 1 : 100 193.8 1 : 1000 249.3 The numbers assigned to each paste can be used to show whether a statistical difference exists between products. Thus, in the cited example, Paste G is significantly inferior to Paste E, but Paste E is not significantly different from Paste 13. It must be appreciated that such numerical values serve only to establish a test for significance. They do not repre- sent an absolute scale of cleaning, nor can they be used to say one prod- uct cleans so many times better than another. This is because, when constructing such an hierarchy, the lowest paste is arbitrarily given the value of zero. This would be obvious if all the pastes were high cleaners, for, whichever paste had the lowest score, it would be made zero despite the obvious fact that, in another test, that paste could be shown to be superior to other lower cleaning toothpastes. A measure of the absolute differences between dentifrices can be made when there is a considerable wealth of data for each product. In this case, and in contrast to the comparison method already described, each "after 2 weeks" photograph is compared with each "after prophy- laxis" photograph for every subject who has ever been asked to undergo the test. Assuming that a dental prophylaxis represents the state of best practical cleanliness, it is possible to show that one dentifrice will build up x% less stain in 2 weeks than another product. In this experiment, each product is compared with a standard clean state, which contrasts with the earlier described test in which each product was compared with another product. Statistically, the latter procedure is more sensitive and capable of greater discrimination. To refer once again to Table I in which products were ranked in order of their enamel abrasivities, it is clear that the ranking of cleaning abili-
Purchased for the exclusive use of nofirst nolast (unknown)
From: SCC Media Library & Resource Center (library.scconline.org)