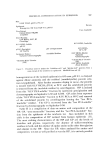
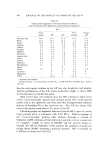
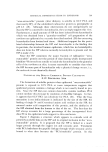
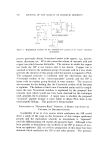
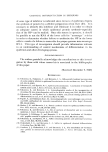
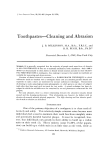
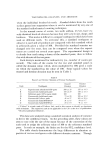
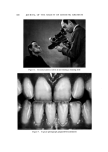
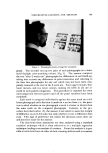
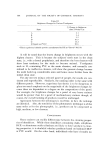
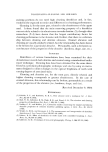
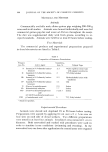
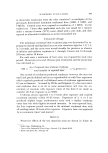
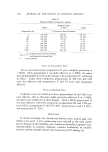
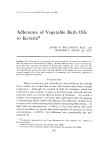
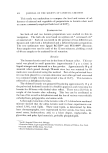
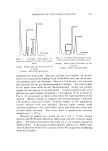
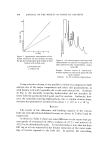
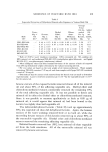
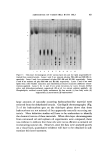
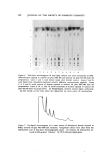
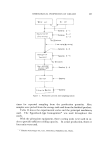
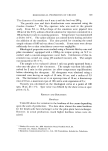
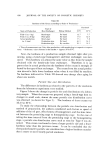
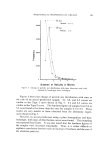
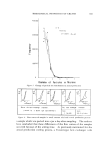
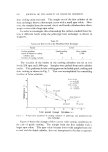
ADHERENCE OF VEGETABLE BATH OILS 617 noleate Palmitate Oleate Figure 1. Gas-liquid chromato•mn of wintcrized cottonseed oil fatty acid methyl esters Sample: Methyl esters of cottonseed oil (1.0 X 10 -• g) Column: DEGS 10% liquid phase almitate 1 Oleate Linoleate 18:•or20:0 Figure 2. Gas-liquid chromatogram o• win- terized soybean oil fatty acid methyl esters Sample: Methyl esters of soybean oil (1.0 X 10 -6 g) Column: DEGS 10% liquid phase methylate free fatty acids. After the reaction was complete, the methyl esters were extracted by adding 10 ml of distilled water per ml of reac- tion medium and 1 ml of hexane. One to 4 v1 of hexane were removed and injected into the gas chromatograph for analysis. The peak height of the major fatty acids on the chromatographic tracing was plotted against the micrograms of oil methylated. A typical quantitation curve plotting the peak heights of linoleate rs. micrograms of oil is shown in Fig. 3. It is necessary to check at least daily the reproducibility of the method. Minute changes in reagents and chromatographic conditions will produce inaccurate results. Control samples of the appropriate keratin extracts were also analyzed. Keratin lipids contain small amounts of pahnitic, oleic, and linoleic esters, and these were taken into account when necessary. The lower limit of quantitative accuracy samples was 1 X 10 -s g. Mineral oil analysis was carried out on a 3-ft X 1/8-in. column packed with 80-90 mesh Anachrom ABS coated with OV-3 silicone liquid phase. The mineral oil used in this study was a very complex mixture of hydrocarbohs. A special gas chromatographic analysis on a 200-ft capil- lary column showed this oil to contain at least 50 components of differing molecular weights.

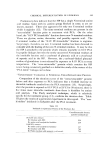
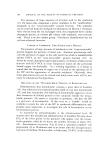
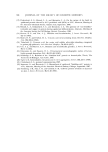
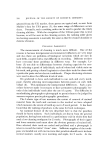
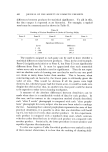
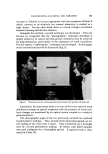
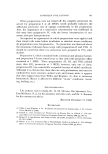
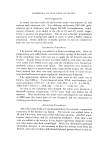
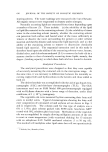
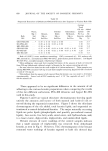
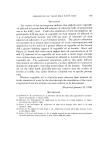
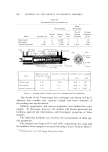
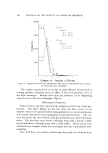
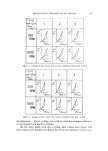
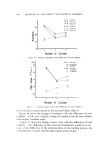
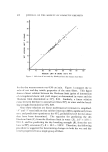
618 JOURNAL OF THE SOCIETY OF COSMETIC CHEMISTS 500 • 200 E • ,oo •- 8o 60 'gO 20 I 2 3 4 5 Oil Figure 3. Quantitative measurement of win- terized cottonseed oil and soybean oil using the gas-chromatographic peak height of their linoleic acid methyl esters ¸ Cottonseed oil [] Soybean oil B Figure 4. Gas chromatogram showing actual determination of mineral oil component (A) and natural keratin hydrocarbons compo- nents (B) Sample: Hexane extract of "dehydrated" keratin exposed to mineral oil-Igepal RC-520 bath emulsion Column: 1% OV-3 (silicone) liquid phase Using a shorter column, it was possible to isolate by comparative GLC analysis one of the major components and relate this quantitatively, as with linoleic acid with vegetable oils, to the total mineral oil. As shown in Fig. 4, the naturally occurring hydrocarbon did not interfere di- rectly with the particular GLC peak used for analysis. Indirectly, how- ever, the naturally ocurring hydrocarbons, due to similar elution times, decrease the quantitative accuracy from about 1 X 10 -s to 1 X 10 -7 g. RESULTS The results of the adherence and binding capacity of the various bath oils with dchydrated-dcfattcd kcratin arc shown in Tables I and II, respectively. As shown in Table I, there was some difference in the mean total per cent uptake of cottonseed oil (10%), soybean oil (11%), and mineral oil (8%) by the dehydrated keratin. It was interesting to note that less than 0.01 mg of oil was removed by the hexane extraction of the water wash- ings of keratin exposed to the bath oils. In general, the succeeding
Purchased for the exclusive use of nofirst nolast (unknown)
From: SCC Media Library & Resource Center (library.scconline.org)