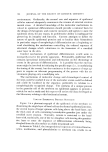
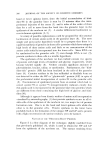
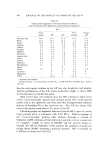
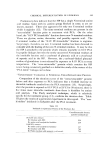
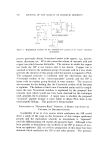
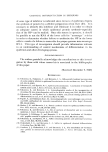
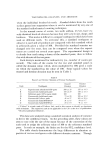
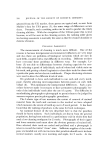
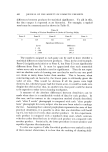
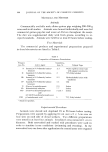
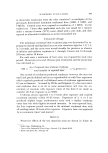
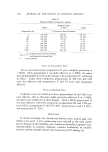
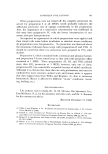
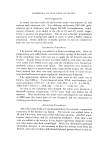
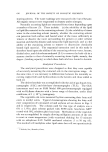
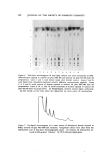
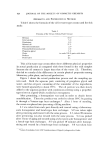
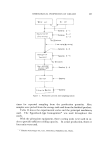
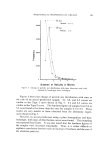
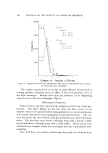
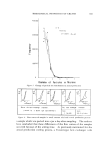
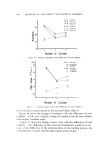
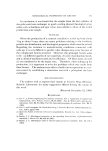
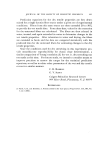
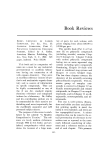
RHEOLOGICAL PROPERTIES OF CREAMS 631 40000. 30000, 20000 10000' t - ...... (•) Type Hardness . 12 • 13 Type Hardness . 3~6 3 4 5 Diameter of Particles in Microns Figure 3. Change of particle size distribution with time laboratory-scale trial (treated by bench-type heat exchanger) Figure 4 shows the change of particle size distribution with time in the case of an actual production sample. S-I, S-2, and S-3 curves are similar to the Type 1 curve shown in Fig. 3. S-4 and S-5 curves are similar to the Type 2 curve. The hardness figures of samples from S-4 to S-5 were found to be lower than the ones for samples S-1 to S-3. These results are very similar to those obtained from the laboratory experi- ment shown in Fig. 3. However, in actual production using a plant homogenizer and heat- exchanger, both types of distribution curves were found. This sampling was repeated four times. It was also noted that the hardness figures of the samples were increased remarkably. Thus, it is rather difficult to explain a correlation between such an increase of hardness and the size of the emulsion particles.

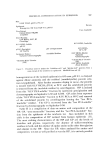
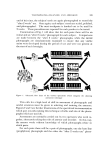
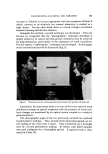
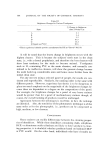
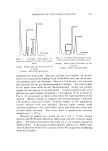
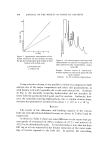
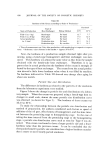
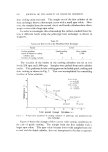
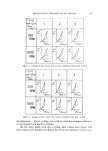
632 JOURNAL OF THE SOCIETY OF COSMETIC CHEMISTS 40000. 30000, 20000' lOOO0 • s-1 I S 2 (- - ,1• Type S-3 Hardness S- 1 -28- S-2 20 v28 $-3 20v26 l"• •__ (•) Type Hardness : ' S-4 12 •18 S-5 10•19 S-5 • 1 2 3 4 Diameter of Particles in Microns Figure 4. Change of particle size distribution with time in actual production (treated by bench-type heat exchanger) The authors assumed this to be due to some delicate factors such as cooling gradient, shearing stress, or effect of the back pressure valve of the heat exchanger. Results show that the hardness varies depending tipon the size of the heat exchanger (Fig. 5). Rheological Properties Figure 6 shows the flow curves of the samples picked from actual pro- duction. The three figures on the left show the flow curves of the samples which were picked before homogenization in actual production and treated with bench-scale equipment as mentioned earlier. The ver- tical axis shows the rate of shear, and the horizontal axis shows the shear stress. The first flow curve shows a dilatant loop with a narrow width the second shows a dilatant loop with a wide width. These curves were obtained from samples which were packaged into jars immediately after sampling. The third flow curve shows a thixotropic loop and was obtained from
Purchased for the exclusive use of nofirst nolast (unknown)
From: SCC Media Library & Resource Center (library.scconline.org)