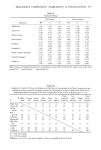
FRAGRANCE COMPLEXITY, FAMILIARITY & PLEASANTNESS 257 Table II Familiarity Rating First session Second session Substance M F T M F T Musk base 3.00 3.05 3.03 3.70 3.41 3.59 (1.85) (1.92) (1.91) (2.03) (1.82) (2.10) Lemon oil 4.78 5.13 4.99 5.33 5.08 5.18 (1.90) (1.67) (1.97) (1.55) (1.87) (1.84) Linalyl acetate 2.91 3.27 3.13 3.79 3.26 3.47 (1.64) (1.98) (2.03) (1.74) (1.76) (1.84) Rive Gauche 4.60 5.33 5.04 5.08 5.29 5.21 (1.72) (1.63) (1.91) (1.28) (1.64) (1.43) Goldrose 4.30 4.94 4.69 4.95 4.94 4.94 (1.71) (1.89) (1.96) (1.45) (1.70) (1.51) Isoeugenol 2.60 2.80 2.72 3.25 3.00 3.10 (1.77) (1.47) (1.83) (1.72) (1.59) (1.73) Hexyl cinnamic aldehyde 2.43 2.97 2.76 3.25 3.64 3.49 (1.70) (1.91) (1.99) (1.96) (1.70) (2.01) Lavender bouquet 4.69 4.38 4.50 4.83 4.91 4.88 (1.76) (2.07) (1.97) (1.46) (1.62) (1.57) Ylang oil 3.39 2.77 3.01 4.29 3.50 3.81 (1.58) (1.80) (2.01) (1.70) (1.86) (2.08) Mean scores and standard deviations (in parentheses) of male (M) and female (F) subjects and of the total group (T). (1 = low familiarity, 7 = high familiarity). Table III Complexity: Number of Times the Substances in the Rows (A) were Judged to be More Complex than the Substances in the columns (B). Example: Lemon Oil was Judged to be more Complex than Musk by 40 Respondents Musk was Judged to be more Complex than Lemon Oil by 19 Respondents. N = 59. Musk base Lemon oil Linalyl Hexyl Lav- Total B Musk Lemon Linalyl Rive Gold- Iso- Cinnamic ender Ylang More Base Oil Acetate Gauche rose eugenol Aldehyde Bouquet Oil Complex , • 19 17 10 21 16 25 15 6 129 40 t •35 32 36 27 43 • 21 16 250 421 24 • 27 26 455 15 18 220 49•27 36 •40 • 29 37 28 8 254 382 23 32 19 • 26 425 23 17 220 435 32 33 30 33 •455 25 16 257 34 16_ 14 22 17 14 •10 4 131 441 38• 44 •_ 31_ 36 34 49 • • 19 295 53 • 43 • 41 • 515 42 • 43 • 555 40 • 368 acetate Rive Gauche Goldrose Isoeugenol Hex. cinn. aid. Lavender bqt. Ylang oil •p 0.01 (two-tailed). 2p 0.05 (two-tailed). Differences 26 in the "total more complex" column are significant at the 5% level.

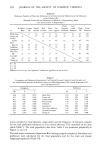
258 JOURNAL OF THE SOCIETY OF COSMETIC CHEMISTS Table IV Preference: Number of Times the Substances in the Rows (A) were Preferred over the Substances in the Columns (B). (Example: Lemon Oil was Preferred over Musk by 25 Respondents, Musk over Lemon Oil by 33 Respondents.) Hexyl Lav- B Musk Lemon Linalyl Rive Gold- Iso- Cinnamic ender Ylang Total A Base Oil Acetate Gauche rose eugenol Aidehyde Bouquet Oil Preferred • 33 43 • 25 32 51 372 36 47 • Musk base 304 Lemon oil 25 •372 19 25 48 • 26 33 39 • 252 Linalyl acetate 15 21 • 15 42 • 13 23 382 179 Rive Gauche 33 39 • 46 • •39 • 52 • 36 44 • 51 • 340 Goldrose 285 26 33 43 • 19 • 53 • 36 372 382 7 10 16 6 5 • 11 18 27 100 cinn.
Hex.
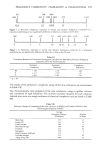
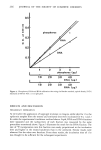
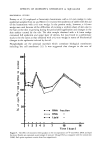
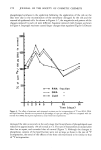
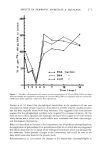
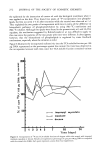
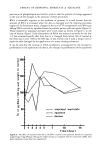
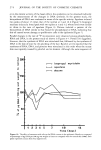
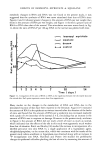
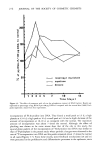
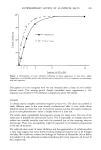
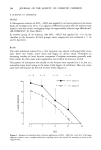
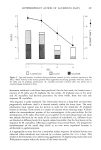
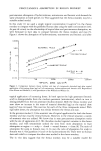
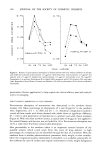
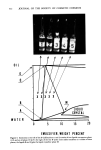
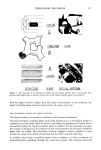
Isoeugenol aid. 21 32 45 • 22 22 47 • •.• 31 40 • 260 Lavender bqt. 22 25 35 14 214 •0 27 • 382 222 Ylang oil 11 19 20 7 20 31 18 20 146 N = 58. •p .01. 2p .05. Differences 27 in the "total preferred" column are significant at the 5% level. Table V. Complexity and Preference, Expressed as Unit Normal Deviates Using the Least Complex and the Least Pleasant Stimulus as Reference Points for Male Respondents (M), Female Respondents (F) and Total Population (T). Complexity Preference M F T M F T 0.00 0.21 0.012 Musk base 1.65 1.00 1.145 0.47 0.97 0.644 Lemon oil 1.06 0.84 0.868 0.27 0.85 0.500 Linalyl acetate 0.76 0.38 0.479 0.34 1.06 0.656 Rive Gauche 1.54 1.34 1.349 0.26 0.85 0.499 Goldrose 1.27 1.02 1.024 0.65 0.91 0.682 Isoeugenol 0.00 0.00 0.000 0.09 0.00 0.000 Hex. cinn. aidehyde 1.20 0.81 0.911 0.7i 0.207 0.879 Lavender bouquet 0.96 0.63 0.711 1.01 1.873 1.312 Ylang oil 0.73 0.08 0.300 more complex (or more pleasant, respectively) and the frequency of the least complex (or the least preferred) substance as unit normal deviates. This treatment of the data yields Table V. The total population data from Table V are presented graphically in Figure 1 a and 1 b. The rank order correlations (Spearman Rho) among judged complexity, familiarity and preference were calculated for the total population and for the male and female subgroups separately (Table VI).
Purchased for the exclusive use of nofirst nolast (unknown)
From: SCC Media Library & Resource Center (library.scconline.org)