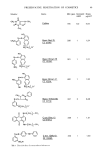
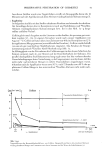
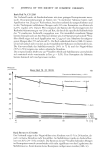
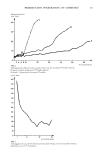
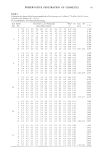
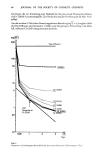
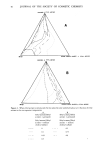
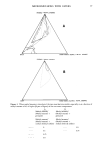
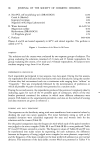
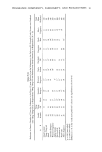
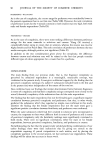
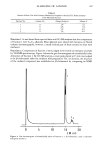
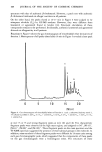
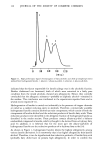
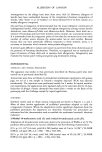
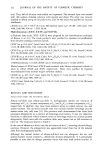
108 JOURNAL OF THE SOCIETY OF COSMETIC CHEMISTS spectrum with that of authentic/•-cholestanol. However, a patch test with authentic /•-cholestanol indicated no allergic reactions in all patients. On the other hand, the peaks eluted at 16-17 min in Figure 4 were judged to be triterpene alcohols (C30) by GC-MS analyses. However, they were different from lanosterol or agnosterol found in lanolin (14). Structural elucidation of these compounds remains to be performed. Incidentally, authentic lanosterol and agnosterol showed no allergenicity in all patients. Fraction 3. Figure 5 shows the gas chromatogram of trimethylsilyl ether derivatives of fraction 3. Mass spectra of all peaks eluted after 16 min in Figure 5 revealed a base peak 6 4 0 5 10 15 20 (Min) Figure 5. Gas chromatogram of trimethylsilyl ethers of fraction 3. 1 and 2. unknown (hydroxy sterol ?), 3-8. alkane-c•,odiols (3. iso-C28, 4. n-C28 + anteiso-C29, 5. iso'C30, 6. n-C30 q- anteiso-C3• , 7. iso-C32, 8. n-C32 q- anteiso-C33 ) at m/e 73 or 75 and strong fragment peaks at m/e 103 and• 149. Five characteristic fragment peaks were observed in the high mass region, and assigned to M +, (M-15) +, (M-31) +, (M-90) +, and (M-lOS) +. These fragment peaks on the mass spectrum and the •H-NMR spectrum suggested the presence of two hydroxyl groups in the molecule. In addition, mass numbers of these fragment peaks were different by 14 mass units among each gas chromatographic peak, which suggested that the components of these peaks on the gas chromatogram were a homologous series. The structures of these

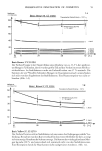
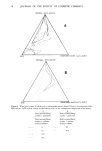
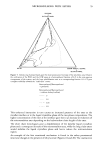
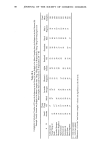
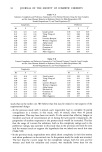
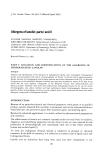
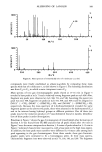
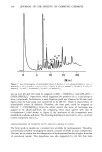
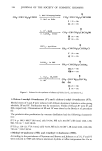
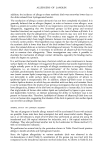
ALLERGENS OF LANOLIN 109 1000- i 50 100 M/E % -8 .10 / .... ,,.... I, 150 200 1000- • - i Z - W -- • _ Z o 250 300 350 400 M/E Figure 6. Mass spectrum of trimethylsilyl ether of n-dodecane-l,12-dio|. -8 -0 450 compounds were finally established as alkane-o•,c0-diols by comparing these mass spectra with that of n-dodecane-l,12-diol shown in Figure 6. The homolog distribution was from C28 to C33, in which a main component was n-C30. Mass spectra of two gas chromatographic peaks eluted at 15-16 min in Figure 5 revealed a base peak at m/e 73 and a relatively strong fragment peak at m/e 458. Also, fragment ion peaks were observed at m/e 368, 533, and 548. Assuming the parent ion peak was m/e 548, fragment ion peaks at m/e 533, 458, and 368 could be assigned to (M-15) + (--CH3) , (M-90) + (--(OSi(CH3) 3q-H)), and (M-180) + (--2(OSi(CH3) 3q-H)), respectively. Because the mass spectrum of 6-hydroxycholesterol revealed the same fragment pattern as the above two peaks, these were assumed to be hydroxysterol (C27) and to be isomers having hydroxyl groups at different positions. One of these two peaks may be the reduction product of 7-oxocholesterol found in lanolin. Identifica- tion of these peaks is under investigation. Fraction 4. Figure 7 shows the gas chromatogram of trimethylsilyl ether derivatives of fraction 4. It was found from GCrMS analyses that all peaks eluted after 14.5 min in Figure 7 were the same compounds as fraction 3. A series of peaks eluted at 5-15 rain in Figure 7 indicated characteristic mass spectra, with a base peak in the high mass region. In addition, the base peak mass numbers were different by 14 mass units among each peak appearing in the gas chromatogram. From these results, these gas chromato- graphic peaks were estimated to be a homologous series. In their mass spectra, characteristic fragment ions were observed at m/e 73, 103, 149, and 205. The fragment
Purchased for the exclusive use of nofirst nolast (unknown)
From: SCC Media Library & Resource Center (library.scconline.org)