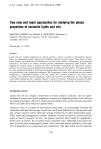
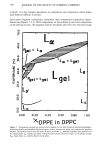
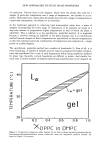
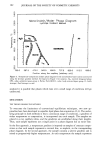
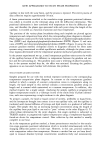
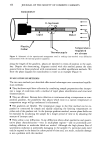
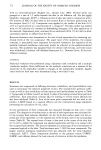
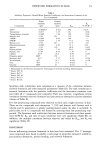
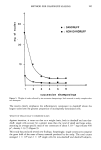
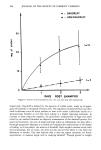
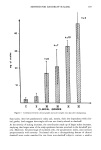
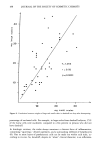
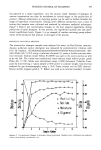
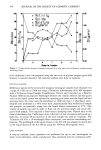
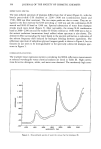
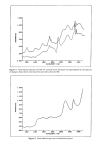
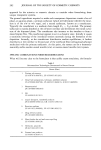
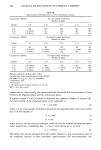
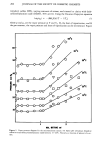
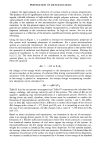
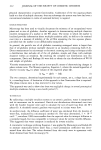
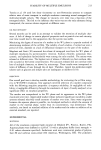
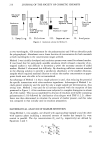
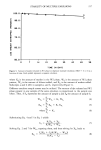
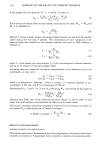
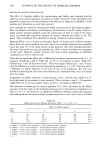
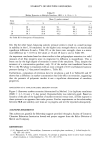
PROCESS CONTROL OF SHAMPOO 193 has glycerol as a major ingredient, into the process vessel. Samples of shampoo of various composition can then be withdrawn at several stages in the production of product. Manual adjustments to metering pumps can be used to further broaden the range of ingredient concentration. During seven different production runs a total of seventy-five samples were collected and analyzed by reference analytical techniques. Figure 2 depicts the concentration changes in the four targeted ingredients during production of good shampoo. In this process, the ingredients quickly met and main- tained equilibrium levels. Figure 3 is an example of random metering pump adjust- ments which produced bad product at all stages of the process. REFERENCE ANALYTICAL METHODS The seventy-five shampoo samples were analyzed for water via Karl Fischer titration. Anionic surfactant (active detergent) was measured by potentiometric titration with 0.02 M hyamine 1622(diisobutylphenoxyethoxyethyl-dimethyl-benzyl-ammonium chlo- ride) (Fluka AG 53752) using a surfactant electrode (3) versus a double-junction refer- ence electrode. Sodium nitrate (Orion 94-0009) was used in the outer junction as well as for the ISA. The titrant was standardized versus sodium lauryl sulfate (puriss. grade Fluka AG 71729). Solids were determined using a CEM Automatic Volatility Com- puter by microwaving a 1-gram sample at 50% power to constant weight. Glycerol was analyzed by gas chromatography using a 10-ft Tenax column and an ECD detector. Benzyl alcohol (reagent grade J. T. Baker) was used as an internal standard. A multi- O.....-o o Rctlvl t!=t Sol ids [] Ho i sture ß G lycerol .Ill 1.1•0 O.00 1 3 5 7 o il 13 Figure 2. Compositional changes in shampoo during processing. Samples were withdrawn and analyzed several times during a production run.

194 JOURNAL OF THE SOCIETY OF COSMETIC CHEMISTS m4 o Rctivitw l\ Solid! I\ Moi!,t. ce o -- .00 • -- I.BO 0.00 1 3 5 7 o 11 Scal• I • Number' Figure 3. Compositional changes in shampoo processed in a pilot plant with deliberately malfunctioning metering pumps. level calibration curve was prepared using the area ratio of glycerol (reagent grade EM Science) to internal standard. All chemical analyses were done in duplicate. SPECTRAL ANALYSIS Reflectance spectra of the seventy-five shampoo training set samples were obtained over a range of ! 100 nm to 2500 nm using a Technicon InfraAnalyzer (I/A) 500 equipped with a Technicon Liquid Sample Transflectance Drawer and controlled via a Hewlett Packard 1000 microcomputer. Pathlength between the ceramic reflector and the quartz cover in the liquid drawer was adjusted by injecting pure water into the liquid cell and screwing down the cover until the absorbance at 1940 nm read 1.5 absorbance units. Samples were preheated in a 40øC water bath. Approximately fifty milliliters of sample was pumped via peristaltic pump into the liquid drawer maintained at 45øC. This volume of sample was used in order to flush out the previous sample and insure ade- quate fresh sample. This required a three-minute pumping time. Optical data in the form of absorbance (log 1/reflectance) were collected in 4-nm increments and stored on a hard disc. A second 50-ml injection of the same sample was used as a replicate. The Technicon I/A 450, a 19-wavelength filter instrument, was used for downloading cali- brations. The pathlength of the liquid drawer in the I/A 450 was adjusted to match that in the liquid drawer of the I/A 500 by using the 1940-nm filter against water. DATA ANALYSIS A step-up multiple linear regression was performed for up to nine wavelengths on water, active detergent, solids, and glycerol. Also calculated were the correlation coeffi-
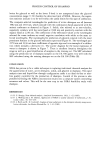
Purchased for the exclusive use of nofirst nolast (unknown)
From: SCC Media Library & Resource Center (library.scconline.org)