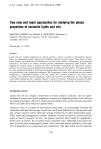
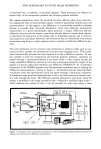
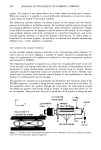
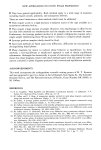
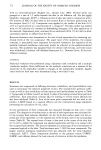
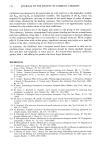
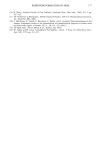
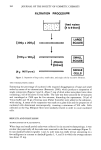
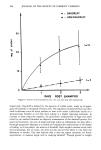
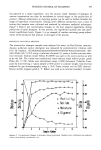
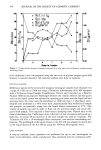
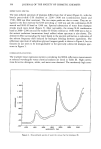
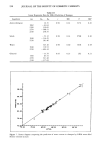
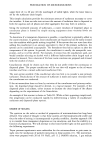
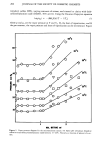
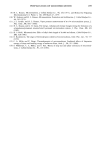
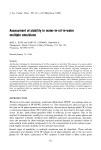
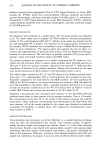
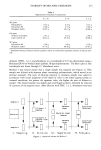
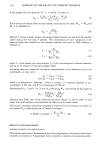
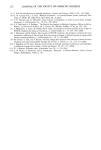
200' t.000- ß 800' ß 500. ß 400' ß 200 [ O. 000 '" A B I ' I ' I ' I ' I • I ' I 1200 •.400 •.600 •800 2000 2200 •400 WAVELENGTH (nm) Figure 5. Near-infrared spectum of dried raw material active detergent (A) superimposed on the spectum of shampoo from which water has been spectrally subtracted (B). 1. 300 ][ 1. 200 t 1. 100! t.000 300 -8øø t ß 700' .600' ß 500- .400' ß 300' I • • ' .• • I" • '-t-- ' -t-- ~--•* I iP-00 1400 :t600 1800 P..000 2200 2400 WAVELENGTH (nm) Figure 6. Near-infrared spectrum of anhydrous glycerol.

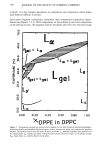
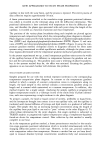
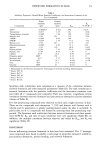
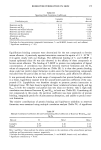
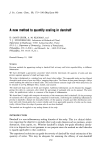
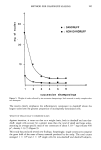
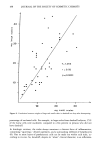
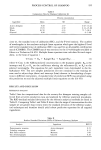
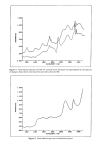
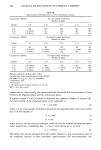
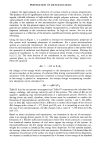
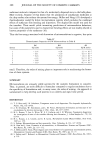
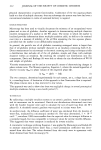
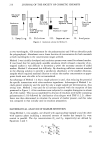
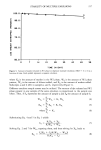
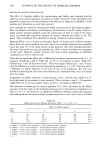
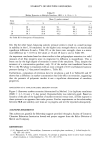
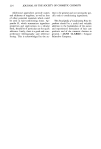
198 JOURNAL OF THE SOCIETY OF COSMETIC CHEMISTS Table III Linear Regression Data for NIRA Prediction of Shampoo Ingredient nm K o . . . K n r SEC F SEP Active detergent 16.15 0.99 0.24 3276 0.26 1982 - 63.64 2190 339.69 2270 -508.41 2210 258.35 Solids - 52.12 0.99 0.34 9768 0.30 1940 - 136.45 2230 381.46 Water 345.16 0.99 0.60 3018 0.58 1940 119.53 2230 -604.44 Glycerol - 33.79 0.93 0.23 262 0.21 1445 63.41 2270 341.46 2336 -317.63 95.00- 90.00. 85. oo. 80.00- 75.00- 70. OC 70 O0 75. O0 80. O0 85. O0 90. O0 95. O0 ACTUAL Figure 7. Scatter diagram comparing the prediction of water content in shampoo by NlRA versus Karl Fischer titration (actual).
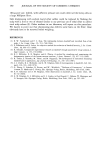
Purchased for the exclusive use of nofirst nolast (unknown)
From: SCC Media Library & Resource Center (library.scconline.org)