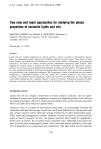
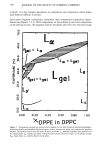
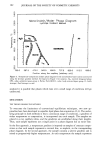
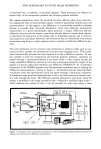
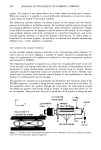
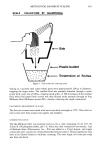
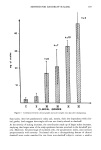
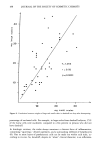
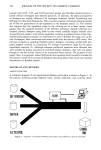
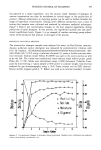
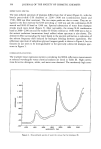
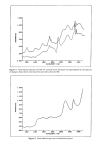
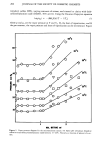
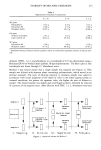
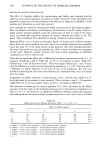
NEW APPROACHES TO STUDY PHASE PROPERTIES 165 capillary in line with the x-ray beam, and the process is repeated. The entire process of data collection requires approximately 30 min. A linear potentiometer attached to the translation stage generates positional informa- tion which is recorded on the videotape along with the diffraction information. This positional information is later correlated with temperature so that the diffraction pat- tern, and therefore the phases type associated with each point along the length of the capillary, is recorded as a function of position and thus temperature. The positions of the various phase boundaries along each isopleth are plotted against temperature and composition from which the corresponding phase diagram is obtained. Phase diagrams constructed for fully hydrated mixtures of dipalmitoylphosphatidylcho- line (DPPC) and dipalmitoylphosphatidylethanolamine (DPPE) (Figure 1) and mix- tures of DPPC and dimyristoylphosphatidylcholine (DMPC) (Figure 2) using the tem- perature gradient method correspond closely to diagrams obtained for these same systems using conventional so-called equilibrium methods, although the phase coexis- tence regions determined with the temperature gradient method are generally narrower. In the present experimental set-up, a small temperature gradient exists across the width of the capillary because of the difference in temperature between the gradient rod sur- face and the surrounding air. This gradient may cause a widening of phase boundaries, but in the systems studied thus far, the effect was minimal. Encasing the gradient apparatus in an evacuated chamber will eliminate this problem. THE LYOTROPE GRADIENT METHOD Samples prepared for use with this method represent isotherms in the corresponding temperature-composition phase diagram. In contrast to the temperature gradient method in which a sample of constant composition varies in temperature along its length, the lipid sample in this method contains a concentration gradient along its length and is scanned while maintained at a constant temperature. In addition, this method requires but a single sample. Analyzing the sample capillary at progressively higher temperatures results in a videotape record of the entire body of phase informa- tion, each scan representing a single isotherm in the phase diagram. To prepare a sample, the lipid or liquid crystal of interest, preferably in liquid form, and the lyotrope are brought into contact in an x-ray capillary tube, and the capillary is incubated until mutual diffusion of lyotrope and lipid results in a gradient of sufficient length. The sample then has an increasing lyotrope concentration along the length of the capillary from pure lipid at one end to "pure" solvent at the other (Figure 6). To collect phase information for the entire diagram, this single capillary is subjected to TRXRD analysis at progressively higher temperatures using a temperature-regulated forced-air device for temperature control. Data collection by this method is usually complete in one hour. As in the temperature gradient method, a linear potentiometer attached to the transla- tion stage generates positional information which is recorded simultaneously with the changing diffraction pattern on video tape. However, in this case, position correlates with composition rather than temperature. Because a method has not yet been devel- oped to measure absolute lyotrope concentration nondestructively and noninvasively

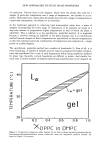
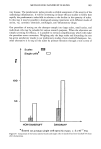
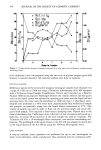
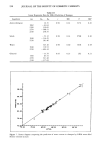
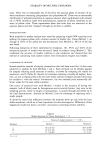
166 JOURNAL OF THE SOCIETY OF COSMETIC CHEMISTS Goniometer X-ray beam Lipid Water Plastic/ Collar Thermocouple Temperature- regulated air stream Figure 6. Schematic of the experimental arrangement used in making time-resolved x-ray diffraction measurements with the lyotrope gradient apparatus. along the length of the gradient, phases are reported in terms of position in the capil- lary. Despite this shortcoming, diagrams created with this method possess the same general form as those produced with conventional, so-called equilibrium methods. We show the phase diagram for monolinolein in water as an example (Figure 3). EVALUATION OF METHODS The two new methods just described offer several advantages over conventional equilib- rium methods: ß They facilitate rapid data collection by combining sample preparations that incorpo- rate a range of conditions with a method of rapid phase identification and structural characterization. ß They are efficient. Because data collection is continuous along a temperature or com- position gradient, the possibility that phases which exist in a narrow temperature or composition range will go undetected is eliminated. ß The gradients are flexible. The temperature range in the first method can be ex- panded or contracted by simply and rapidly adjusting the limiting temperatures on either end of the gradient rod. In the lyotrope gradient method, narrow phase fields can be extended by incubating the sample for a longer period of time or by adjusting the amount of lyotrope used. ß They utilize x-ray diffraction. X-ray diffraction allows direct qualitative and quanti- tative phase characterization--even in multiphase regions--and no potentially per- turbing additives or molecular labels are needed. Although the high photon flux of synchrotron radiation is potentially damaging to the sample (7), particular parts need only be exposed to the beam for a short period of time and, as a result, radiation damage is not a problem with this method.
Purchased for the exclusive use of nofirst nolast (unknown)
From: SCC Media Library & Resource Center (library.scconline.org)