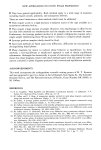
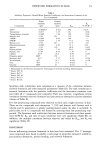
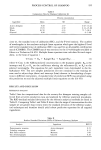
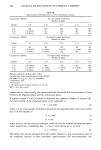
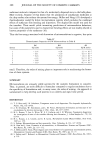
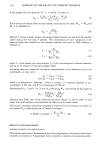
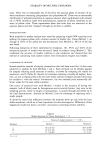
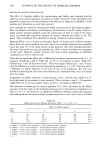
PROCESS CONTROL OF SHAMPOO 195 Table I Composition Data for Shampoo Calibration Set Percent concentration Ingredient Mean SD Range Active detergent 9.68 2.57 0.07 - 16.41 Solids 15.65 4.39 0.33 -23.86 Water 83.59 4.33 75.7-98.4 Glycerol 0.98 0.63 0- 2.08 cient (r), the standard error of calibration (SEC), and the F-level statistic. The number of wavelengths in the resultant multiple linear equation which gave the highest F-level and lowest standard error of calibration (SEC) was used for an all-possible-combination search (COMBO). The COMBO search was restricted to the 19 wavelengths available as filters in a Technicon I/A 450. Multiple linear equations were calculated for each ingre- dient, in the form of equation 1 % Conc = K 0 + K•log(1/R•) + K210g(1/R2) . . . (1) where % Conc is the NIRA-predicted concentration in the shampoo sample. K o is the intercept and K1 to K n are the coefficients relating the reflectance (R1 to Rn) at the selected wavelengths. The equations for each ingredient were downloaded to the In- fraAnalyzer 450. Ten new samples (prediction set) not contained in the training set were used to adjust slope (skew) and intercept (bias) inherent in downloading of equa- tions to different instruments. A standard error of prediction (SEP) was calculated using this prediction set and the adjusted multiple linear equations on the I/A 450. RESULTS AND DISCUSSION REFERENCE ANALYSIS Table I lists the compositional data for the seventy-five shampoo training samples col- lected from all seven production runs and analyzed by reference analytical procedures. The RSD (residual standard deviations) for the reference analytical methods are listed in Table II. Comparing Table I and Table II shows that the range of concentrations for this sample set are greater than twenty times the standard deviation of the reference analyt- ical techniques and therefore should yield robust prediction equations for all targeted ingredients. Table II Residual Standard Deviations (RSD) of Reference Laboratory Analyses Analysis Ingredient RSD % Potentiometric titration Active detergent 0.21 Volatility computer Solids 0.3 ! Karl Fisher titration Moisture 3.00 Gas chromatography Glycerol 0.26

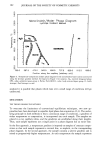
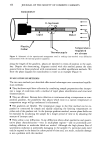
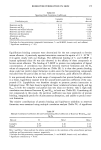
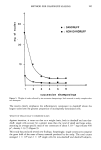
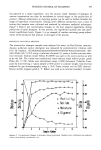
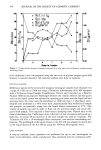
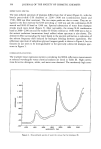
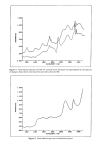
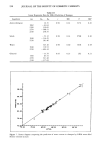
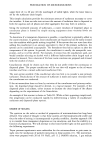
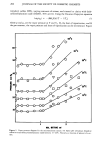
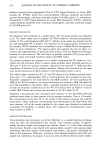
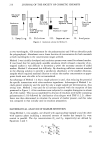
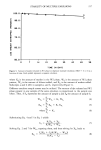
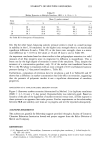
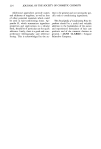
196 JOURNAL OF THE SOCIETY OF COSMETIC CHEMISTS REFLECTANCE SPECTRA The near-infrared spectrum of shampoo differs from that of water (Figure 4), with the barely perceivable C-H doublets at 2200-2400 nm (combination band) and 1700-1800 nm (first overtone). The two major peaks are due to water. They are as- signed to the first overtone for O-H stretching at 1440 nm and the combination O-H stretch and H-O-H bend at 1940 nm. Spectral subtraction of water from shampoo reveals much more detail (Figure 5). Most noticeably, the strong N-H combination band at 2000-2200 nm and the weaker N-H first overtone at 1500-1600 nm is due to the anionic surfactant (ammonium lauryl sulfate) whose spectrum is also shown. The derivative effect surrounding the water bands in the spectral subtraction is indicative of the solvent frequency shift induced by hydrogen bonding between ingredients. The reflectance spectrum of anhydrous glycerol (reagent grade) is shown in Figure 6, but its features do not seem to be distinguishable in the spectrally subtracted shampoo spec- trum in Figure 5. CORRELATION STATISTICS The multiple linear regression statistics correlating the NlRA reflectance measurements at selected wavelengths versus chemical analyses are listed in Table lll. High correla- tions for active detergent, solids, and water were obtained. The moderately high corre- l.fi00- •.400 •.200' • t.000- .800- .fiO0 .400' 1400 lfiO0 •BO0 2000 2200 2400 WAVELENGTH (nm) Figure 4. Near-infrared spectra of water (A) versus that for shampoo (B).
Purchased for the exclusive use of nofirst nolast (unknown)
From: SCC Media Library & Resource Center (library.scconline.org)