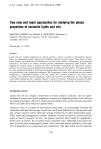
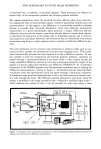
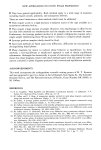
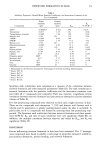
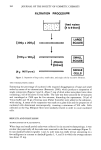
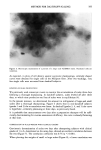
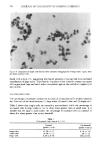
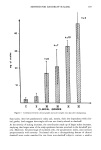
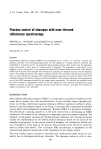
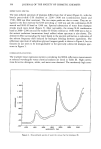
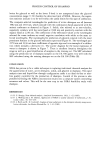
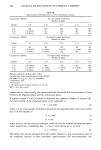
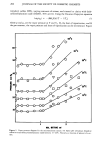
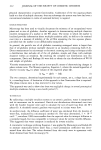
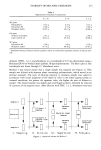
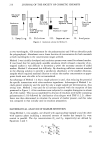
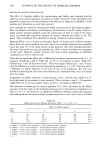
STABILITY OF MULTIPLE EMULSIONS 215 Table I Representative Emulsion Compositions 4.3, 10 6, 10 4.3, 6 W1 phase Polyporphyre 0.25 g 0.25 g 0.25 g Polysorbate 80 0.00 g 0.53 g 0.00 g Phosphate buffer 50.05 g 49.61 g 49.88 g Oil phase Sorbitan monooleate 2.01 g 2.01 g 2.00 g Light mineral oil 48.24 g 48.30 g 48.08 g W2 phase Polysorbate 80 2.28 g 1.60 g 0.38 g Phosphate buffer • 97.74 g 98.40 g 99.63 g • Emulsions having a balanced osmotic gradient utilize an osmotically equivalent amount of sodium chlo- ride. drofuran (THF), 1:2.2, and absorbance at a wavelength of 522 nm determined using a Beckman DU40 or Perkin Elmer Lambda 3B spectraphotometer. The Beer's plot at this wavelength was linear through 0.7 absorbance units. Method 2 was similar except that a single sample was required (see Figure 2). This sample was diluted with aqueous phase containing polytartrazine, which served as an external standard. The ratio of diluting solution to emulsion sample was varied in accordance with visual judgment of the depth of color in the lower aqueous phase in creamed emulsions: the greater the apparent color, the higher the ratio of diluent to sample. The diluted sample was shaken and centrifuged as above, followed by removal of a portion of the aqueous layer. After dilution with THF, 1:2.2, absorbance was read sample Emulsion sample b • I. Sompl in 9 • D1 luent 1 Buqqer -• Diluent • Buq?er with Marker II. Dilution Aqueous Layer • Emulsion Layer (waste) Aqueous Laye• Clariqied Solution Clari?ied Solution I I I. Separat i on I V. Ana 1 ys i s Figure 1. Analytical scheme for Method 1.

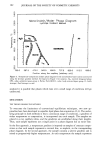
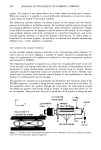
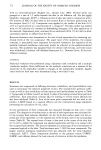
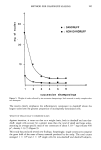
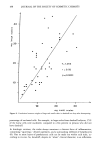
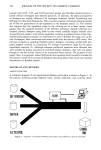
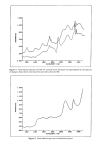
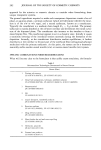
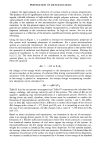
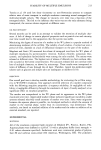
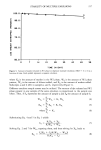
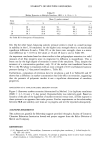
216 JOURNAL OF THE SOCIETY OF COSMETIC CHEMISTS Emulsion sample Emu 1 s i on • "• Di lured • Emulsion Di luent with external standard Separated Aqueous Phase Waste Emulsion layer Clari?ied Aqueous Layer I. Somplin 9 II. Dilution III. Seporotion IV. Anolysis Figure 2. Analytical scheme for Method 2. at two wavelengths, 426 (maximum for the polytartrazine) and 548 nm (shoulder peak for polyporphyre). Absorbance was a linear function of concentration for both materials at both wavelengths in the concentration ranges utilized. Method 1 was initially developed and emulsion systems were tested for released marker. It was found that for particularly unstable emulsions which released a majority of en- trapped marker it was difficult to determine a priori the necessary amount of added marker. Method 2 eliminated this difficulty. By dissolving sufficient external standard in the diluting solution to provide a satisfactory absorbance at the smallest dilutions, samples which required maximal dilution to reduce the marker concentration to appro- priate levels were also able to be accommodated. An advantage of Method 1 is that a single polymer is used, thus reducing the potential for specific interactions with other emulsion ingredients. Advantages of Method 2 in- clude greater simplicity and the need for only a single sample per determination, thus saving time. Method 2 was used for all systems reported with the exception of data presented in Figure 3. A few emulsions were subjected to complete disruption to release all of the marker. This was accomplished by dilution of emulsion with buffer containing polytartrazine (1:10) followed by clarification of an aliquot with THF (1:2.2). Absor- bance was then determined to calculate the amount of marker present, and this value was compared to that initially used in emulsion preparation. MATHEMATICAL ANALYSIS OF MARKER RETENTION Using Method 1, two samples, one diluted with aqueous phase (sample a) and the other with aqueous phase including a measured amount of marker dye (sample b), were treated in parallel. The dye concentrations (C a and Cb, respectively) are defined by Equations 2 and 3: C a = XEa (2) WEa •- WAa XEb + XK (3) C b = WE b -•- WAb
Purchased for the exclusive use of nofirst nolast (unknown)
From: SCC Media Library & Resource Center (library.scconline.org)