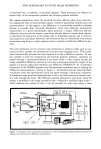
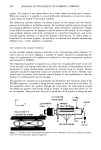
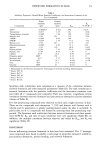
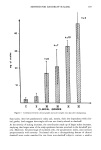
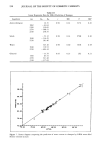
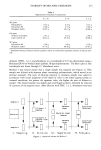
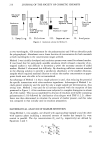
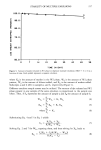
STABILITY OF MULTIPLE EMULSIONS 219 tants. There was no measurable loss of dye from the aqueous phase of mineral oil-in- water emulsions containing polyporphyre and polysorbate 80. There was no measurable distribution of polytartrazine from an aqueous solution when equilibrated with mineral oil in W/O emulsions made with polytartrazine, separated oil phase exhibited an ab- sence of yellow color. These experiments show that both dyes are restricted to the aqueous phases and that transport through an oil film is unlikely. MARKER RECOVERY Both methods for marker analysis were tested by preparing simple O/W emulsions and spiking the aqueous phase with a known amount of marker dye. Using Method 1, an average of 102% of the added dye was determined with Method 2, 98.1% of the dye was found. Following disruption of three representative emulsions, 101, 98.8, and 102% of the theoretical amount of marker was recovered, based on analysis using Method 2. This confirmed the accuracy of marker addition to the emulsions and showed that the method of calculating total marker content from formulation weights was reliable. COMPARISON OF METHODS Several emulsion samples of varying composition that had been stored for 34 days were subjected to analysis by both Methods 1 and 2. Both methods can be reliably applied for samples releasing small amounts of marker, as shown by compaing the results for emulsions a and b (Table II). Results for emulsions releasing virtually all marker, how- ever, are not as reproducible as for the more stable systems (compare standard deviations for emulsion c with the others). Furthermore, the two methods yield statistically dif- ferent values for the least stable emulsion. One source of potential error with Method 1 resides in the necessity of having two samples, both of which must be homogeneous and accurately known. Any error in the sampling process, either in weight or homogeneity, is carried through and shows up in the final determination. Analysis by Method 2 has the advantage of requiring only a single sample. It should be noted that differences between the methods show up only with the least stable emulsions, which are of least importance for this investigation. Differences of this magnitude would not lead to incorrect conclusions concerning relative stability. Table II Marker Retention for Various Emulsions (n = 3) Percent of marker retained (+/- S.D.) Emulsion Method 1 Method 2 a 98.4 (0.05) 98.4 (0.06) b* 92.9 (0.18) 93.2 (0.66) c 11.7 (0.80) 3.7 (1.2)

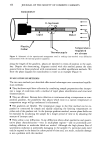
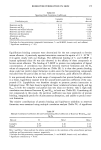
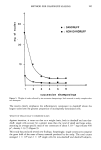
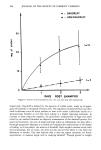
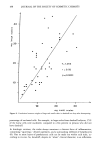
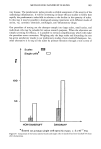
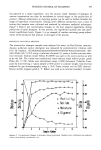
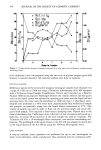
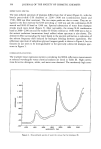
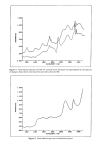
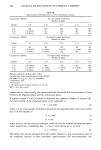
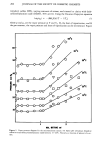
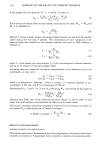
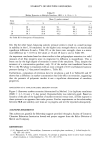
220 JOURNAL OF THE SOCIETY OF COSMETIC CHEMISTS MARKER AND BUFFER CONCENTRATION The effect of changing marker dye concentration and buffer ionic strength and the influence of an osmotic gradient are shown in Tables III and IV. Each formulation was prepared in triplicate, and each emulsion was analyzed in triplicate by Method 2 (nine analyses per formulation at each time interval). Ionic strength was varied by adjusting the buffer concentration in both aqueous phases. Since the marker contributes a small amount of electrolyte to the kV! phase, there is a slight osmotic pressure gradient across the intervening oil film. In some of the emul- sions, an osmotically equivalent amount of sodium chloride was added to the W2 phase. These emulsions were identified as having a balanced osmotic pressure. Reproducibility of the analytical technique based on results with different samples taken from the same emulsion was quite good the standard deviation was generally much less than 1% of the mean percent of dye retained. All of the formulations had a relatively high yield one day post manufacture 96% or more of marker was entrappeal at that time. However, marker retention over time varied, depending on surfactant composition as well as other factors. There was no significant effect due to differences in marker concentration in the 4.3, 10 emulsion (emulsions a and b, Table III). In the 6, 10 emulsion (a and b, Table IV), differences at 1 and 28 days were minor. There were larger variations at 7 and 14 days only the difference at seven days was statistically significant, p 0.05. This was due to a difference in release behavior on the part of one of the emulsions. We were not justified in rejecting the data from that emulsion on a statistical basis, so it is included with the others. Comparison of marker retention in formulations b and c indicate that stability is af- fected adversely by an increase in ionic strength. This is evident in the 4.3, 10 emulsion (Table III) and, to an even greater extent, in the 6, 10 emulsion (Table IV). The influence of balancing the osmotic gradient (0.33 arm, calculated by the Morse equation (12)) that exists in the multiple emulsions due to the presence of marker is not clear cut. In 4.3, 10 emulsions, no significant differences between osmotically balanced and unbalanced emulsions are evident (compare results for c and d and b with e in Table Table III Marker Retention in Multiple Emulsions, HLB -- 4.3, 10 (n = 3) Mean % marker retained Time (days) a b c d e 1 99 98 99 100 98.9 7 97 96.7 99 99 97.2 14 95 95.4* 98 98 95.2 28 93.4 92.4 98 98 92.3 a: marker -- 0.256% ionic strength = 0.04 balanced osmotic pressure. b: marker = 0.5% ionic strength = 0.04 balanced osmotic pressure. c: marker -- 0.5% ionic strength = 0.01 balanced osmotic pressure. d: marker = 0.5% ionic strength -- 0.01 osmotic pressure gradient. e: marker = 0.5% ionic strength = 0.04 osmotic pressure gradient. *n=2.
Purchased for the exclusive use of nofirst nolast (unknown)
From: SCC Media Library & Resource Center (library.scconline.org)